
Multimedia Gallery
Round-Trip Time Measurements
Round-Trip Time Measurements
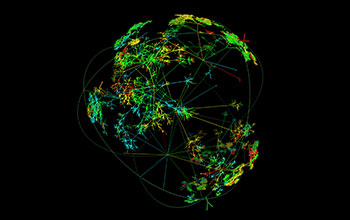
Round-Trip Time Internet Measurements from CAIDA's (Cooperative Association for Internet Data Analysis) Macroscopic Internet Topology Monitor.
This graph was created using the Walrus graph visualization tool, designed for interactively visualizing large directed graphs in 3-Dimensional space. By employing a fisheye-like distortion, it provides a display that simultaneously shows local detail and the global context. The Walrus tool was developed with support from DARPA NGI N66001-98-2-8922 and DARPA NMS N66001-01-1-8909; from National Science Foundation grants ANI 99-96248 and NSF N66001-01-1-8909; and with the support of CAIDA members. CAIDA is based at the University of California's San Diego Supercomputer Center. To learn more about the Walrus tool, or to view additional Walrus-created graphs, visit the Cooperative Association for Internet Data Analysis (CAIDA) Web site at http://www.caida.org/tools/visualization/walrus/.
Please Note: Before using this image, please read the detailed restrictions regarding any possible use, below under "Restrictions." (Date of Image: 2002) [One of two related images. See Next Image.]
More about this Image
As the Internet has grown, so has the challenge of accurate measurement and modeling of its topology. Commonly used but coarse methods of measuring topology, for example, BGP (Border Gateway Protocol, a routing protocol most commonly used between autonomous systems) tables, suffer from several limitations. To pursue more accurate empirically-based topology modeling, CAIDA began its macroscopic topology project in 1998. The project focus is actively measuring topology and round-trip time (RTT, the time interval between the moment a probe is sent and the moment a response is received) across a wide cross-section of the commodity Internet. For further information, see the paper "Topology Discovery by Active Probing", the tool Skitter and CAIDA's analysis page.
CAIDA's topology monitors send out traceroute-like packets to as many as several hundred thousand destinations everyday while measuring round-trip time and recording the forward path taken by the packets. Our visualization shows a single cycle of measurements made by the monitor in Herndon, Va on Feb 2, 2002. From this data, we created a graph showing the topology of the Internet covered by the probes. We then overlaid RTT measurements on the links. Since links, properly speaking, do not have RTTs, and since the monitor collects RTTs to destinations only (and not also to the routers lying along the path), we colored a link by the median of the RTTs seen for all destinations that were reached through the link. Thus the color of a link summarizes the performance characteristics of all destinations that fan out from the link. Clusters of one color indicate clusters of destinations with similar latency values from this source monitor. This coloring also allows one to see the intermediate nodes at which performance begins to diverge.
Geographical location has some effect on the RTTs one can expect from a destination. As the following plot (based on a different set of data collected from San Diego, Calif.) shows, there is a rough correlation between physical distance and RTT. RTTs exhibit a trimodal distribution in which the peaks correspond to the east and west coasts of North America and to Europe/Asia. In the Walrus visualizations further below, the cyan links, which indicate the lowest RTTs, are most likely to destinations on the East Coast where the source monitor is located. The green links are most likely to destinations on the West Coast, and the yellow links to destinations in the rest of the world. The red links, indicating RTTs greater than 300ms, are likely showing poor or misbehaving connectivity.
Credit: © 2002 The Regents of the University of California
Special Restrictions: Permission to use, copy, modify and/or distribute any part of this image from the Walrus Gallery for educational, research and nonprofit purposes, without fee and without a written agreement, is hereby granted provided the copyright notice in the "Credit" line, this paragraph and the following paragraph appear in all copies. Those desiring to incorporate these Walrus Gallery Images into commercial products or use for commercial purposes should contact the Technology Transfer & Intellectual Property Services, University of California, San Diego, 9500 Gilman Drive, Mail Code 0910, La Jolla, CA 92093-0910; by telephone, (858) 534-5815; by Fax, (858) 534-7345; or by e-mail, mailto:invent@ucsd.edu.
Images and other media in the National Science Foundation Multimedia Gallery are available for use in print and electronic material by NSF employees, members of the media, university staff, teachers and the general public. All media in the gallery are intended for personal, educational and nonprofit/non-commercial use only.
Images credited to the National Science Foundation, a federal agency, are in the public domain. The images were created by employees of the United States Government as part of their official duties or prepared by contractors as "works for hire" for NSF. You may freely use NSF-credited images and, at your discretion, credit NSF with a "Courtesy: National Science Foundation" notation.
Additional information about general usage can be found in Conditions.
Also Available:
Download the high-resolution TIF version of the image. (12.5 MB)
Use your mouse to right-click (Mac users may need to Ctrl-click) the link above and choose the option that will save the file or target to your computer.