
Multimedia Gallery
May 13, 2009
Images credited to the National Science Foundation, a federal agency, are in the public domain. The images were created by employees of the United States Government as part of their official duties or prepared by contractors as "works for hire" for NSF. You may freely use NSF-credited images and, at your discretion, credit NSF with a "Courtesy: National Science Foundation" notation.
Additional information about general usage can be found in Conditions.
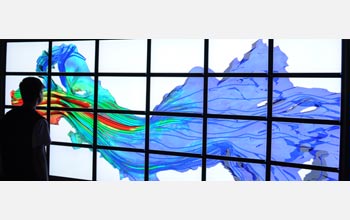
Using VisTrails, researchers can create large visualizations from large data sets.
Using VisTrails, researchers can create large visualizations from complex data sets relatively easily and inexpensively. Here, a river is simulated based on sensor data. The various colors show water speed in different parts of the river.
Credit: Juliana Freire, University of Utah
Images credited to the National Science Foundation, a federal agency, are in the public domain. The images were created by employees of the United States Government as part of their official duties or prepared by contractors as "works for hire" for NSF. You may freely use NSF-credited images and, at your discretion, credit NSF with a "Courtesy: National Science Foundation" notation.
Additional information about general usage can be found in Conditions.
Also Available:
Download the high-resolution JPG version of the image. (545 KB)
Use your mouse to right-click (Mac users may need to Ctrl-click) the link above and choose the option that will save the file or target to your computer.
Related story: A New Vision for Scientific Visualizations