
Multimedia Gallery
June 27, 2011
Images credited to the National Science Foundation, a federal agency, are in the public domain. The images were created by employees of the United States Government as part of their official duties or prepared by contractors as "works for hire" for NSF. You may freely use NSF-credited images and, at your discretion, credit NSF with a "Courtesy: National Science Foundation" notation.
Additional information about general usage can be found in Conditions.
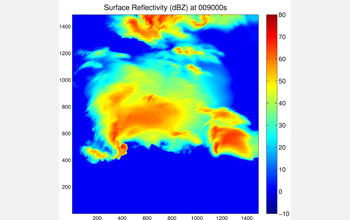
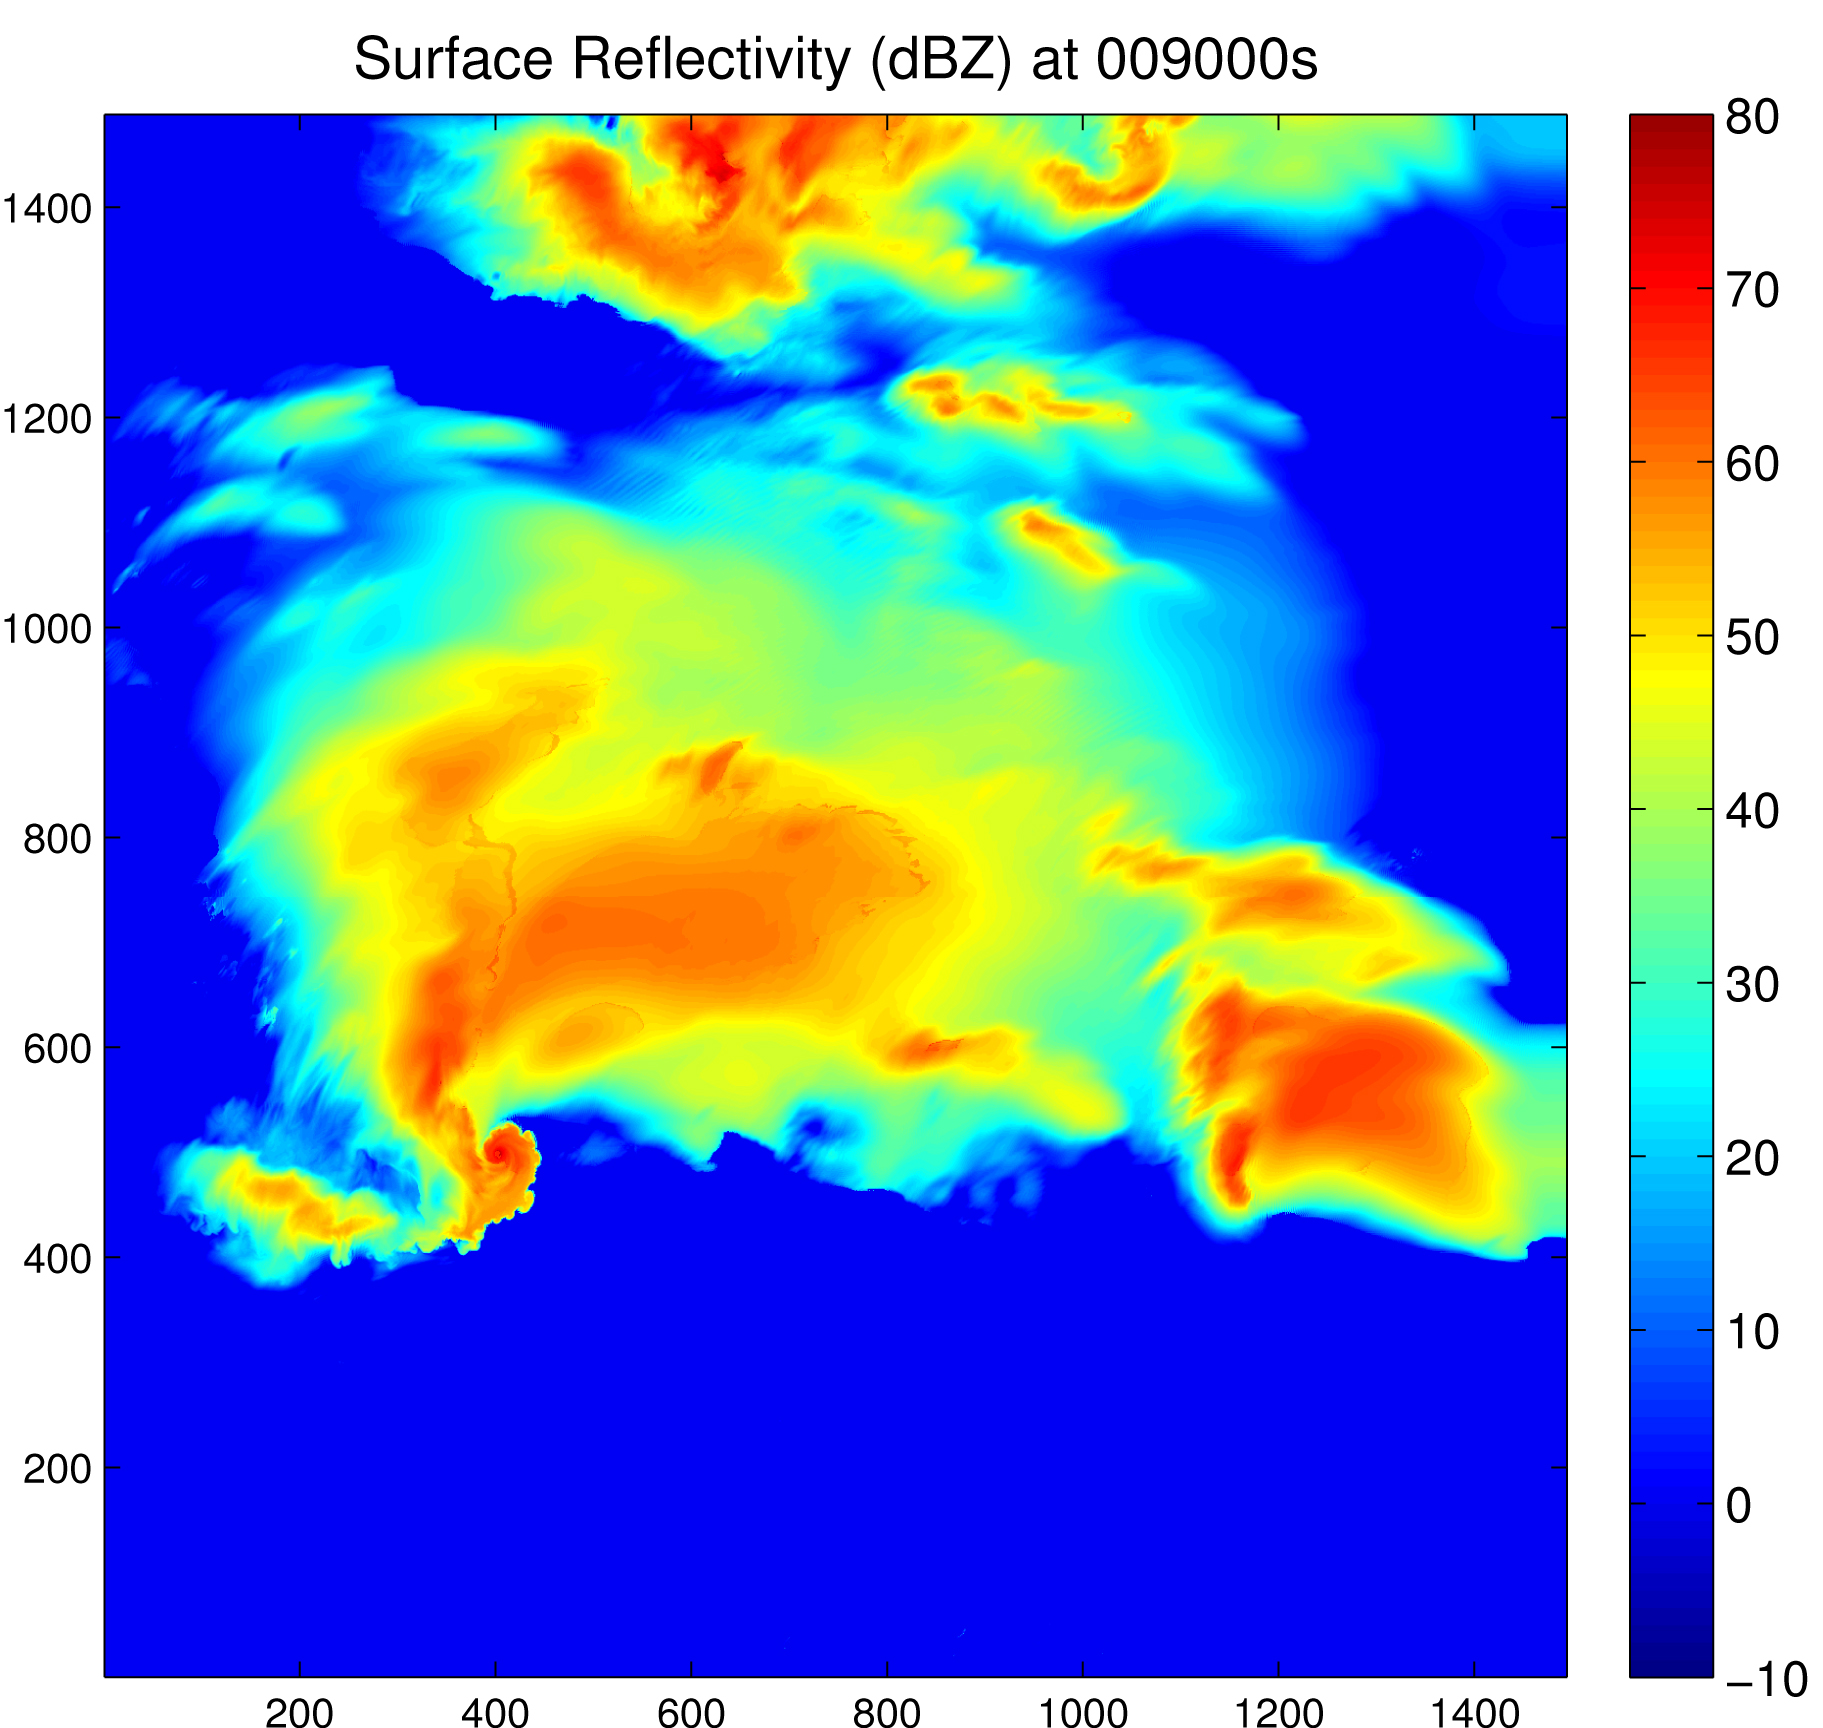
This graph shows the reflectivity at the surface of one of McGovern's simulations.
This graph shows the reflectivity at the surface of one of McGovern's team's simulations. Redder colors indicate a region with more intense precipitation. The graph also shows a hook echo region, a region indicative of a tornado, in the southwest quadrant of the simulation.
Credit: Amy McGovern, School of Computer Science, University of Oklahoma
Images credited to the National Science Foundation, a federal agency, are in the public domain. The images were created by employees of the United States Government as part of their official duties or prepared by contractors as "works for hire" for NSF. You may freely use NSF-credited images and, at your discretion, credit NSF with a "Courtesy: National Science Foundation" notation.
Additional information about general usage can be found in Conditions.
Also Available:
Download the high-resolution JPG version of the image. (1.1 MB)
Use your mouse to right-click (Mac users may need to Ctrl-click) the link above and choose the option that will save the file or target to your computer.
Related story: Supercomputer Simulations to Help Predict Tornadoes