
Multimedia Gallery
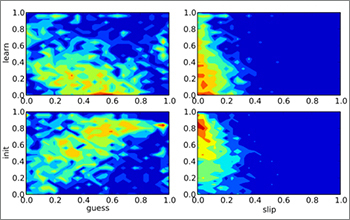
Heatmaps illustrate relationships between underlying measures of student performance and learning.
The LearnSphere project led by Carnegie Mellon University seeks to improve educational outcomes by upgrading the infrastructure for educational data mining. Summarizing data from 8,341 students doing online math problems involving 2,400 skills, these heatmaps illustrate relationships between four underlying measures of student performance and learning: prior knowledge, learning rate, guess rate and slip rate. These measures are used to identify student strengths and weaknesses so educators and educational technology can more efficiently personalize the learning experience for students.
Credit: Steven Ritter, Carnegie Learning
Images credited to the National Science Foundation, a federal agency, are in the public domain. The images were created by employees of the United States Government as part of their official duties or prepared by contractors as "works for hire" for NSF. You may freely use NSF-credited images and, at your discretion, credit NSF with a "Courtesy: National Science Foundation" notation.
Additional information about general usage can be found in Conditions.
Also Available:
Download the high-resolution JPG version of the image. (87.8 KB)
Use your mouse to right-click (Mac users may need to Ctrl-click) the link above and choose the option that will save the file or target to your computer.
Related story: Laying the groundwork for data-driven science