
Multimedia Gallery
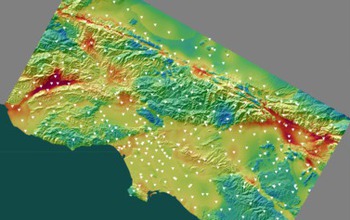
CyberShake map for 336 sites in the Los Angeles region show regions of high and low hazard risk.
CyberShake study 15.4 hazard map for 336 sites (white triangles) in the Los Angeles region. Map displays response spectral acceleration at 2-second periods in units of surface gravitational acceleration for a 2 percent probability of exceedance in 50 years. Warm colors, representing areas of high hazard, often correspond to regions that overlay sedimentary basins including areas near Ventura (left center), Los Angeles (center) and San Bernardino (right center).
Credit: Scott Callaghan, Kevin Milner and Thomas H. Jordan, Southern California Earthquake Center
Images credited to the National Science Foundation, a federal agency, are in the public domain. The images were created by employees of the United States Government as part of their official duties or prepared by contractors as "works for hire" for NSF. You may freely use NSF-credited images and, at your discretion, credit NSF with a "Courtesy: National Science Foundation" notation.
Additional information about general usage can be found in Conditions.
Also Available:
Download the high-resolution PNG version of the image. (1.6 MB)
Use your mouse to right-click (Mac users may need to Ctrl-click) the link above and choose the option that will save the file or target to your computer.
Related story: Los Angeles basin jiggles like big bowl of jelly in cutting-edge simulations