Multimedia Gallery
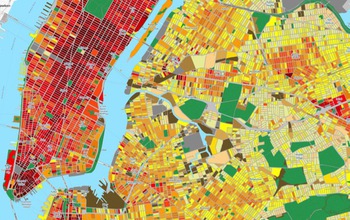
A map estimating the total annual building energy consumption at the block and lot level for NYC.
The map represents an estimate of the total annual building energy consumption at the block level and at the tax lot level for New York City, and is expressed in kilowatt hours (kWh) per square meter of land area. A mathematical model based on statistics, not individual building data, was used to estimate the annual energy consumption values for buildings throughout the five boroughs. Learn more: sel-columbia.github.io/nycenergy/.
Credit: Map created by Shaky Sherpa of Sustainable Engineering Lab (formerly Modi Research Group) Data Source: Spatial distribution of urban building energy consumption by end use B. Howard, L. Parshall, J. Thompson, S. Hammer, J. Dickinson, V. Modi
Images credited to the National Science Foundation, a federal agency, are in the public domain. The images were created by employees of the United States Government as part of their official duties or prepared by contractors as "works for hire" for NSF. You may freely use NSF-credited images and, at your discretion, credit NSF with a "Courtesy: National Science Foundation" notation.
Additional information about general usage can be found in Conditions.
Also Available:
Download the high-resolution JPG version of the image. (212.2 KB)
Use your mouse to right-click (Mac users may need to Ctrl-click) the link above and choose the option that will save the file or target to your computer.
Related story: Establishing a brain trust for data science


