Division of Science Resources Statistics |
|
 |
Directorate for
Social, Behavioral and Economic Sciences |
|
|
|
National Science Foundation
|
NSF 02-306, December 21, 2001
|
Growth Continued in 2000 in Graduate Enrollment in Science and Engineering Fields
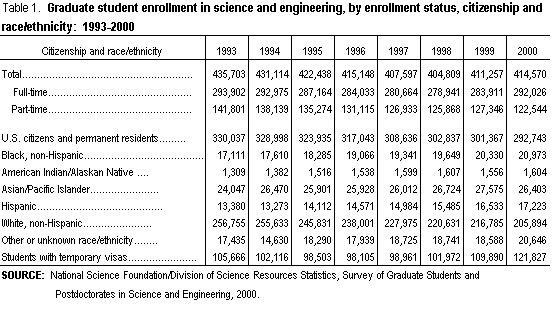
Enrollment of science and engineering (S&E) graduate students in the United States increased in 2000, the second increase in two years (table 1). In Fall 2000, 414,570 students were enrolled in S&E programs at the graduate level, a 0.8-percent increase from the 1999 number of 411,257. Despite the increases, the number of science and engineering graduate students in 2000 was still below the 1993 peak of 435,703. Full-time enrollment increased 3 percent from 1999 to 2000, while part-time enrollment decreased 4 percent. About 70 percent of science and engineering graduate students are enrolled full time.
Enrollment by Citizenship and Race/ethnicity
Students with temporary visas more than accounted for the increase in total S&E graduate enrollment. Enrollment of students with temporary visas increased 11 percent from 109,890 in 1999 to 121,827 in 2000 (table 1). This increase was the fourth consecutive increase in foreign enrollment, following a four-year decline between 1992 and 1996 during which enrollment dropped 10 percent (NSF 2001).
Enrollment of U.S. citizens and permanent residents dropped 3 percent from 1999 to 2000. Among U.S. citizens and permanent residents, the number of white, non-Hispanic graduate S&E students dropped 5 percent from 1999 to 2000, the 7th consecutive annual drop since 1993. Enrollment of Hispanics rose 4 percent and enrollment of blacks and American Indians/Alaskan Natives rose 3 percent each. The number of U.S. citizen and permanent resident Asians/Pacific Islanders enrolled in graduate S&E programs dropped 4 percent from 1999 to 2000 (table 1) and figure 1).
Enrollment by Field
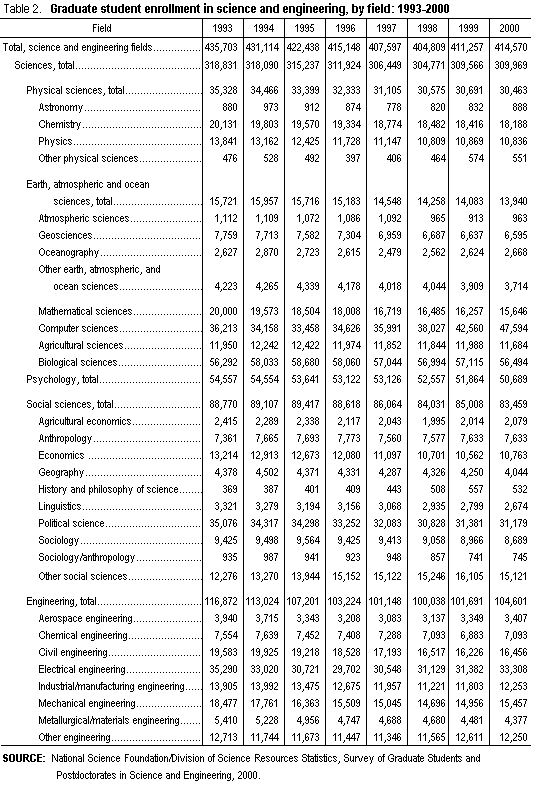
Among science and engineering fields,[1] the greatest gain in enrollment (12 percent) was in computer science. The gain in graduate enrollment in computer science was the largest of any science and engineering field in both absolute number and in percentage increase. Other science fields experiencing gains include astronomy, oceanography, and agricultural economics. Graduate enrollment in chemistry, physics, geosciences, mathematical sciences, agricultural sciences, biological sciences, psychology, and most social sciences continued declines seen over much of the 1990s (table 2).
Engineering enrollment rose 3 percent in 2000, the second increase in two years. A number of engineering fields accounted for the increase, including aerospace, chemical, civil, electrical, industrial, and mechanical engineering. Enrollment in metallurgical and materials engineering continued to decline.
Postdoctoral appointees
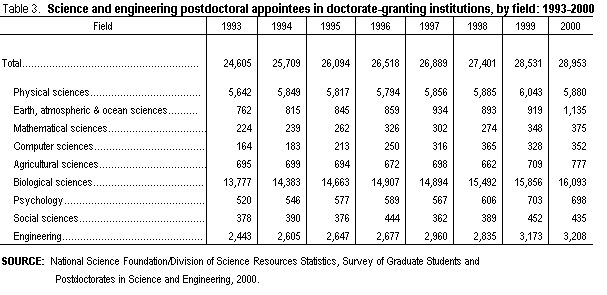
The number of science and engineering postdoctoral appointees ("postdocs") in doctorate-granting institutions rose 1 percent in 2000 to 28,953. More than half (56 percent) of postdocs in 2000 were in the biological sciences. The number of postdocs in the biological sciences increased almost every year since 1993. The number of postdocs in the physical sciences, which account for another 20 percent of postdocs, held fairly steady from 1993 to 2000 (table 3).
Data presented in this Data Brief are from the Fall 2000 Survey of Graduate Students and Postdoctorates in Science and Engineering. Data were collected from approximately 11,800 departments at approximately 600 institutions of higher education in the United States and outlying areas. The departmental response rate was 99 percent; however, 17 percent of the responding departments required partial imputation of missing data. More detailed data are available in the report, Graduate Students and Post-doctorates in Science and Engineering: Fall 2000.
References
National Science Foundation. 2001. Graduate Enrollment in Science and Engineering Increases for the First Time Since 1993. (NSF 01-132) Arlington, VA.
This Data Brief was prepared by:
Joan S. Burrelli
Research and Development Statistics Program
Division of Science Resources Statistics
National Science Foundation
4201 Wilson Boulevard, Suite 965
Arlington, VA 22230
703-292-7793
jburrelli@nsf.gov


