| Division of Science Resources Studies | |
 |
Directorate for
Social, Behavioral and Economic Sciences |
|
|
|
| National Science Foundation |
NSF 00-307, December 15, 1999
|
Graduate Enrollment in Science and Engineering Continued to Decline in 1998
Brian Ilardi
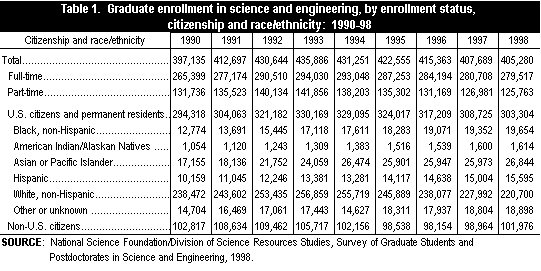
The number of science and engineering (S&E) graduate students in the United States fell in 1998, the fifth consecutive decrease since a peak enrollment in 1993 (table 1). In fall 1998, there were 405,280 students enrolled in S&E programs at the graduate level, a 0.6 percent decrease from the 1997 level of 407,689. Decreases occurred in both science enrollment, which fell 0.5 percent, and in engineering enrollment, which fell 0.7 percent. Part-time S&E enrollment dropped a full percentage point to 125,763; full-time enrollment fell 0.4 percent.
Enrollment by Field
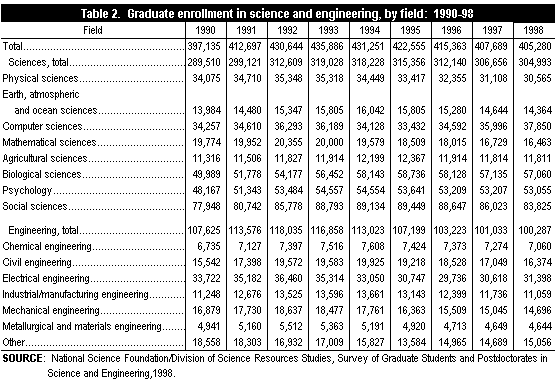
Total enrollment for science programs decreased from 306,656 in 1997 to 304,993 in 1998 (table 2). This decrease occurred in all major science fields except computer science (where enrollment was up 5.1 percent) and agricultural science (which experienced no change). The field where enrollment declined the most was social sciences, with a drop of 2.6 percent. Enrollment dropped by about 2 percent in mathematical sciences (down 1.6 percent); earth, atmospheric, and ocean sciences (down 1.9 percent); and physical sciences (down 1.7 percent). The declines were slight in biological sciences and in psychology (down 0.1 and 0.3 percent respectively).
Engineering enrollment decreased from 101,033 in 1997 to 100,287 in 1998. In two fields, enrollment experienced slight increases: electrical engineering (up 2.5 percent) and “other” engineering (up 2.5 percent). Industrial engineering (down 5.8 percent) and civil engineering (down 4.0 percent) were among the fields that had the greatest decreases in enrollment (table 2).
Enrollment by Citizenship, Sex, and Race/Ethnicity
Foreign student enrollment in S&E in the United States rose 3.0 percent in 1998[1] (table 1). This increase was the second consecutive increase in foreign enrollment following a 4-year decline (between 1993 and 1996) in which enrollment dropped 10.3 percent. Most of this increase was seen in engineering, where foreign student enrollment rose 4 percent between 1997 and 1998. In contrast, graduate enrollment of U.S. citizens and permanent residents dropped 1.8 percent from 1997 to 1998, the fifth drop since a peak in 1993.
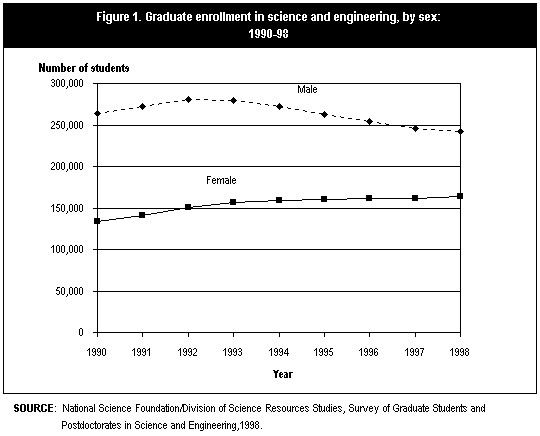
S&E graduate enrollment trends differed somewhat by sex (figure 1). Total enrollment among men decreased—as it has since 1993—dropping 1.6 percent from 245,643 in 1997 to 241,828 in 1998. Female enrollment increased 1 percent to 163,452 in 1998. The increase in female enrollment was attributable entirely to enrollment by nonwhite females, which increased 3.5 percent, while white female enrollment fell 1.7 percent. White male enrollment fell 4.3 percent, in 1998, while nonwhite male enrollment rose 1.3 percent.
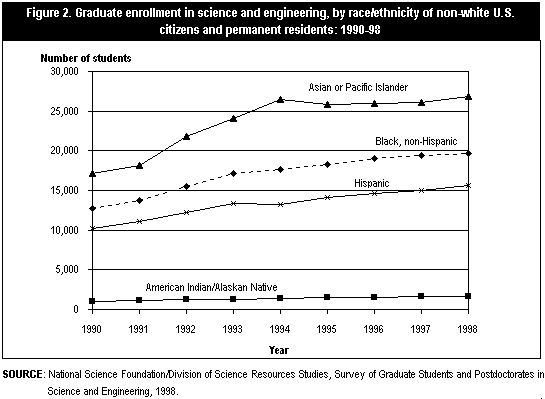
Against a background of declining graduate S&E enrollment, enrollment of minorities continues to rise. Among U.S. citizen and permanent resident graduate students in 1998, 6 percent were black, 5 percent were Hispanic, and 0.5 percent were American Indian/Alaskan Native. S&E graduate enrollment for these groups has been generally increasing in the 1990s (figure 2). From 1997 to 1998, enrollment for blacks rose 2 percent; American Indians/Alaskan Natives, 1 percent; and Hispanics, 4 percent. Enrollment for Asians or Pacific Islanders rose 3 percent.
Data Source
The data presented here were obtained from the National Science Foundation’s 1998 Survey of Graduate Students and Postdoctorates in Science and Engineering. Data were collected from approximately 11,700 departments at 601 institutions of higher education in the United States and outlying areas. The departmental response rate was 98.2 percent; however, 15 percent of the responding departments required partial imputation of missing data. More detailed information is available in the forthcoming report, Graduate Students and Postdoctorates in Science and Engineering: Fall 1998.
For further information contact:
Joan Burrelli
Division of Science Resources Statistics
National Science Foundation
4201 Wilson Boulevard, Suite 965
Arlington, VA 22230
703-306-1774 x6942
jburrelli@nsf.gov


