Science Resources Studies Division
DATA BRIEF Directorate for
Social, Behavioral
and Economic
Sciences

National Science Foundation
NSF 97-322, September 26, 1997

    Services Sector S&E Employment Rises, Then Falls Sharply As Engineering and Technician Jobs Are Cut

by Richard E.
Morrison

Employment of Engineers and Technicians in many services industries exhibits sharp 1988-94 decline, while employment of scientists reverts to 1988 level.

  Employment of scientists, engineers, and technicians in the services sector[1] increased from 1988-91, and then dropped sharply from 1991-94.[2] By 1994 (the last year for which data are available), the number of employed scientists and engineers in services industries (185,200) was 8 percent below the 1988 level of 202,000 and 15 percent below the 1991 level of 219,000 (table 1). Although the sector accounted for only 4 percent of the scientists, 10 percent of the engineers, and 26 percent of the technicians employed in the United States, analysts look to services sector employment as a leading indicator of the health of the S&E labor market as the economy shifts inexorably from a manufacturing toward a services-oriented base.

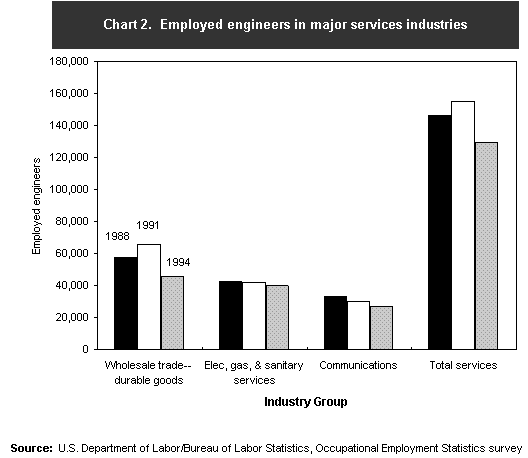
Engineering employment was severely affected by the downturn, as the 1994 total of 129,800 engineers employed in the services sector represented a drop of 11 percent from 1988 and 16 percent from 1991 (table 1).

Technicians suffered proportionately more than scientists and engineers, as technician employment in the services sector fell from 270,500 in 1988 to 258,900 in 1991 and then to 237,500 in 1994, a reduction of 12 percent over the 6-year period.

Principal Employers
The services sector is divided into three major industry groups: transportation, communications, and utilities; wholesale trade; and retail trade. Within those industry groups, 3 industries accounted for 80 percent of total employed scientists and engineers (S&Es) in the services sector in 1994, down from 85 percent in 1988. These industries are wholesale trade-durable goods (31 percent of services S&E employment in 1994); electric, gas, and sanitary services ("utilities," 29 percent); and communications (20 percent). Most of the total sectoral drop in S&E employment between 1988 and 1994 occurred in wholesale trade-durable goods, where 13,500 S&E jobs (19 percent of the 1988 S&E work force) were lost, and in communications, where 9,000 S&E jobs (20 percent of the 1988 S&E work force) were lost (chart 1).


All major services industry groups suffer drops in engineering employment.

  Partially offsetting the sizable loss in S&E jobs in wholesale trade-durable goods and communications were gains in wholesale trade-nondurable goods (2,900 jobs, representing 35 percent of the 1988 S&E work force) and in retail trade (3,300 new jobs representing 34 percent of the 1988 S&E work force) over the 6-year period. Total S&E employment in wholesale trade-nondurable goods and in retail trade together constituted only 13 percent of sectoral S&E employment in 1994. S&E employment in both were down from their 1991 levels (3 percent in wholesale trade-nondurable goods and 10 percent in retail trade).

Employment of Scientists
At first glance, scientists might appear to have escaped the fate that befell their engineer and technician counterparts, as total 1994 employment of 55,400 scientists in the services sector was virtually unchanged from the 1988 figure of 55,500. However, employment of scientists had jumped to 63,900 (an increase of 15 percent) between 1988 and 1991 before falling back to the earlier level in 1994.

Among services industries employing at least 1,000 scientists in 1991, all but one endured 1991-94 declines. These included general merchandise stores and air transportation (both 34 percent), trucking and warehousing (29 percent), transportation services (25 percent), wholesale trade-durable goods (20 percent), furniture and home furnishings stores (18 percent), wholesale trade-nondurable goods (13 percent), miscellaneous retail (5 percent), and electric, gas, and sanitary services (4 percent). Only in communications was there a 1991-94 increase in employment of scientists (3 percent).

Employment of Engineers
Of the 19 services sector industries, 3 of them accounted for 88 percent of all employed engineers in 1994. These were wholesale trade-durable goods, 45,700 (36 percent); electric, gas, and sanitary services, 39,900 (31 percent); and communications, 27,000 (21 percent). All three suffered declines in engineering employment both over the 6-year period 1988-94 and over the shorter 1991-94 period. Wholesale trade-durable goods lost 19,800 engineering jobs between 1991 and 1994 (35 percent of the industry's 1988 engineering work force and 30 percent of its 1991 engineering work force). Engineering job losses were more moderate in the other two large services industries, as electric, gas, and sanitary services lost 2,400 (6 percent) of its 42,300 1988 engineering jobs, and communications lost 6,100 (18 percent) of its 33,100 1988 engineering positions (chart 2).

    Among smaller services industries employing at least 1,000 engineers in 1991, a substantial 1988-94 decline in engineering employment was suffered only by air transportation (4 percent, but 33 percent of its 1991 level), whereas all other such services industries either held their own (general merchandise stores) or increased their employment of engineers. Industries employing at least 1,000 engineers and experiencing 1988-94 increases included miscellaneous retail (67 percent), water transportation (60 percent), furniture and home furnishings stores (40 percent), and wholesale trade-nondurable goods (23 percent).

Employment of Technicians
As with engineering employment, employment of technicians in services was dominated by the same three industries in 1994, and almost (85 percent) to the same extent. Wholesale trade-durable goods employed 92,300 (39 percent) of the sector's technicians, and experienced the most significant declines, a loss of 10,800 jobs (9 percent) between 1988 and 1991, and an additional 13,400 jobs (13 percent) between 1991 and 1994. The combined loss of 24,200 technician jobs in wholesale trade-durable goods from 1988-94 represented 73 percent of the lost technician jobs in the entire services sector over that 6-year period.

Communications, the second largest technician-employing services sector industry group (64,300 jobs, or 27 percent of the sectoral total in 1994) lost 5,200 jobs between 1988 and 1991, but gained 3,000 of them back between 1991 and 1994. Electric, gas, and sanitary services, the third largest employer of technicians in the services sector, lost 5,200 (8 percent) of its 66,500 1988 technician jobs but, like communications, gained 3,000 of them back from 1991-94.

The data presented in this Data Brief are being released in advance of the comprehensive Detailed Statistical Tables report Scientists, Engineers, and Technicians in Trade and Regulated Industries: 1994.

This Data Brief was prepared by:

Richard E. Morrison
Senior Economist
National Science Foundation
Division of Science Resources Studies
4201 Wilson Boulevard
Suite 965
Arlington, VA 22230

For a free copy, write to the above address, call 301-947-2722, or send e-mail to pubs@nsf.gov.


Footnotes

[1] The term "services sector" as used here denotes establishments engaged in wholesale and retail trade, transportation, communications, and utilities. Industries are those included in Standard Industrial Classification (SIC) codes 40-59. Excluded are educational services and state and local government. Other industries traditionally thought of as "services" industries-such as financial, insurance, real estate, and legal services; entertainment; health services; social services; and hotels and other lodging places-are covered under the separate survey cycle "Nonmanufacturing Industries," and were last reported on for the 1993 OES survey cycle. [See Scientists, Engineers, and Technicians in Nonmanufacturing Industries: 1993 (NSF 96-332).] Note that the industry groups referred to here as the "services sector" were denoted as "Trade and Regulated Industries" in previous survey cycles.

[2] These data are compiled from the Occupational Employment Statistics (OES) survey, conducted by the Department of Labor's Bureau of Labor Statistics. Until 1996 U.S. business establishments were surveyed once every three years, with roughly one-third of the establishments covered each year. Starting with the 1996 survey cycle (for which data are not yet available), all establishments employing nonfarm wage and salary workers are being surveyed annually.


previous arrow up arrow