Global R&D: Measuring Commitment to Innovation
Why is this important?
Innovation in the form of new goods, services, or processes builds on new knowledge and technologies, contributes to national competitiveness, and furthers social welfare. Investment in research and development, a major driver of innovation, is vital in knowledge-intensive economies. R&D expenditures indicate the priority given to advancing science and technology relative to other national goals.
Key observations:
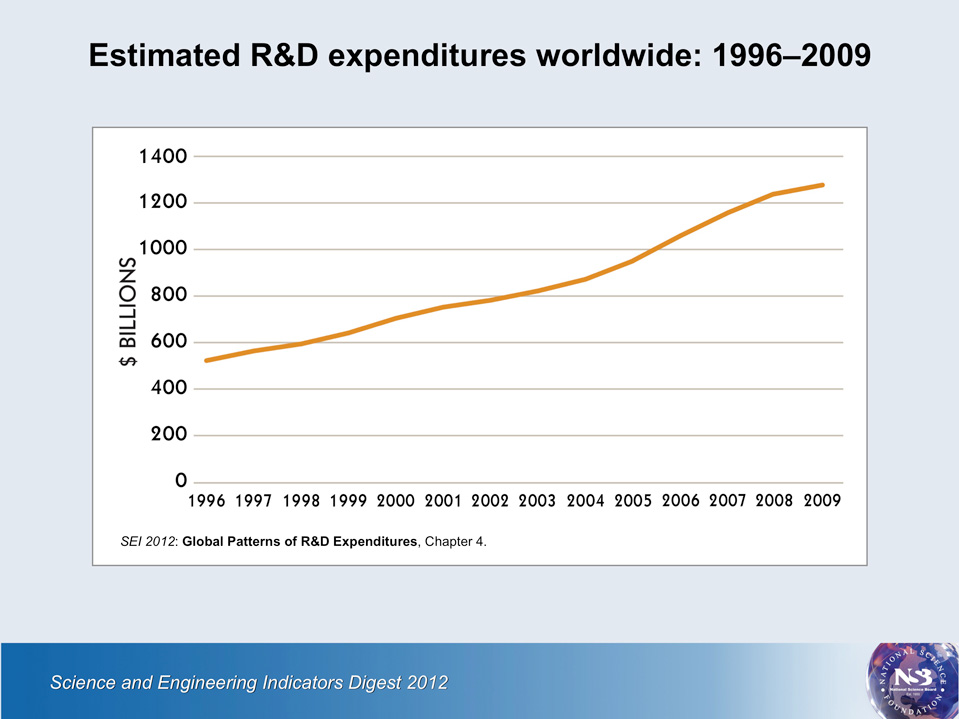
Estimated R&D expenditures worldwide: 1996–2009

- Excel data

- Powerpoint

- Image

Download:
How much?
R&D expenditures worldwide are estimated to have exceeded $1.25 trillion in 2009, up from $641 billion a decade earlier.
R&D expenditures for the United States, European Union, and Asia-10 economies: 1996–2009

- Excel data
- Powerpoint
- Image
Download:
SEI 2012: Global Patterns of R&D Expenditures, Chapter 4.
Where?
U.S. R&D expenditures accounted for about 31% of the worldwide total, down from 38% a decade earlier.
The combined R&D expenditures of 10 Asian economies (China, India, Indonesia, Japan, Malaysia, Philippines, Singapore, South Korea, Taiwan, and Thailand) rose steadily to reach U.S. levels in 2009, driven mostly by China, now the second largest R&D performing nation.
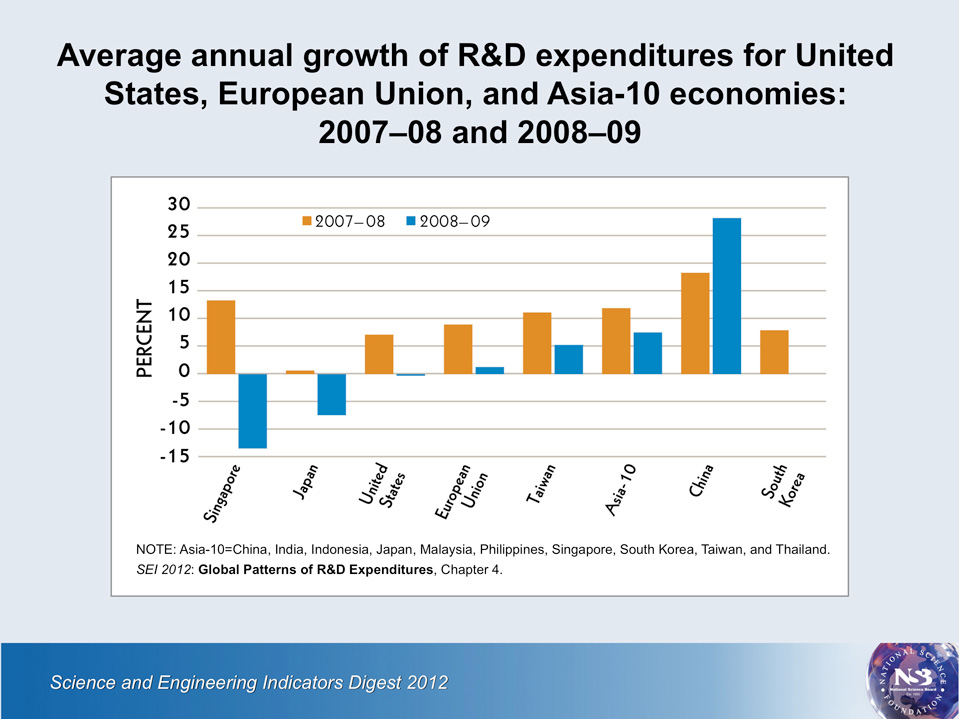
Average annual growth of R&D expenditures for United States, European Union, and Asia-10 economies: 2007–08 and 2008–09

- Excel data
- Powerpoint
- Image
Download:
SEI 2012: Global Patterns of R&D Expenditures, Chapter 4.
Growth
R&D growth of Western and other countries slowed markedly after 2008 in the face of adverse economic conditions. Singapore and Japan experienced especially sharp contractions, and, after accounting for inflation, R&D growth was negative for both the United States and the EU.
In contrast, China's R&D expenditures rose sharply in 2009, at 28% well above its trend-line (1996–2007) average annual growth of 22%. (Just-released data from China's National Bureau of Statistics indicate 2010 R&D growth of 22%).
Rapid R&D growth in Asia overall reflects private spending by domestic and foreign firms and increased public R&D spending that is often focused on sectors deemed to be of strategic importance.
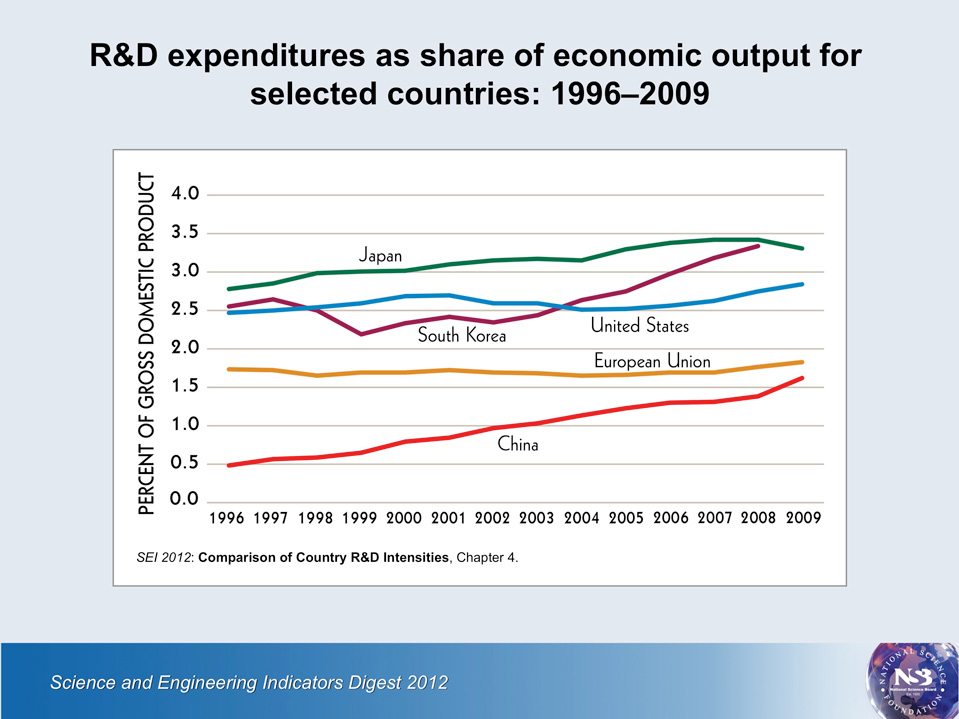
R&D expenditures as share of economic output for selected countries: 1996–2009

- Excel data
- Powerpoint
- Image
Download:
Intensity
R&D intensity measures how much of a country's economic activity (gross domestic product) its R&D investment represents.
Japan committed a higher share of its GDP to R&D than most other large economies but is likely to be surpassed by South Korea. China's R&D intensity increased sharply, as growth in R&D outpaced a rapid expansion in GDP.
The slight 2009 U.S. and EU increases reflect essentially flat R&D expenditures in a year when GDP declined.
