U.S. S&E Workforce: Trends and Composition
Why is this important?
A growing science and engineering workforce contributes to an economy's capacity for innovation. As economies become more knowledge-intensive, S&E skills will be needed in jobs not traditionally considered part of the S&E workforce, such as managers, sales representatives, and financial analysts.
Key observations:
Individuals in S&E occupations and as a percentage of the U.S. workforce: 1983–2010

- Excel data

- Powerpoint

- Image

Download:
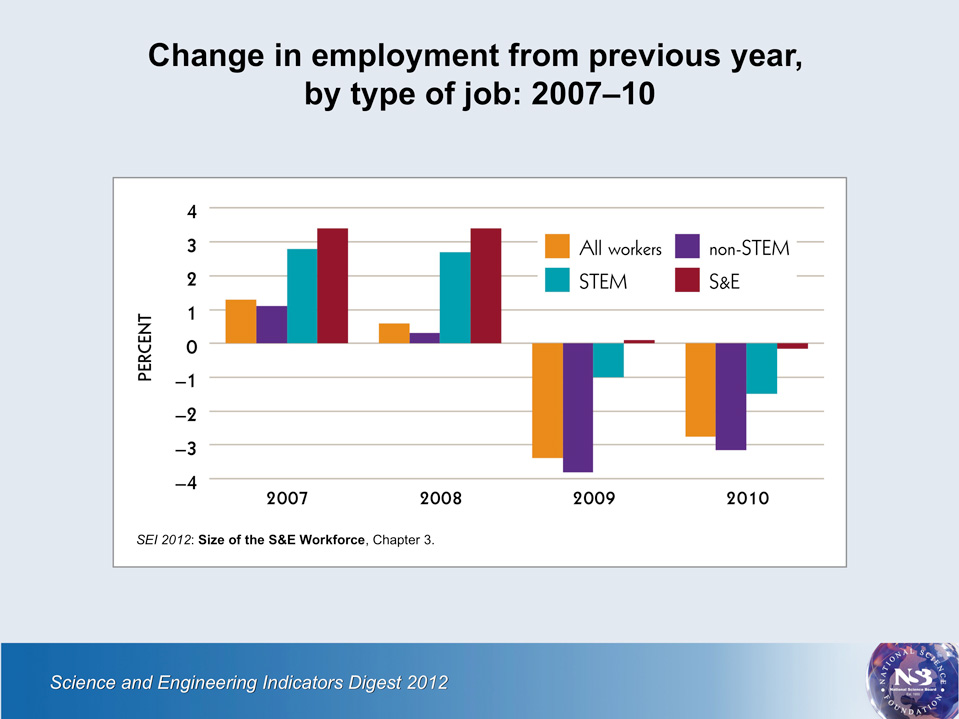
Change in employment from previous year, by type of job: 2007–10

- Excel data
- Powerpoint
- Image
Download:
Workforce growth
The U.S. S&E workforce—made up of chemists, mathematicians, economists, engineers, and other such workers—has grown faster than the workforce overall. Over the past quarter century, it has more than doubled in size and now represents about 4.3% of all U.S. jobs.
The job losses from the 2007–09 recession have been relatively less severe for those in S&E or S&E related jobs than for those in the U.S. workforce overall.
Unemployment rates for all workers, those with bachelor's degree or higher, and those in S&E occupations: 1984–2010

- Excel data
- Powerpoint
- Image
Download:
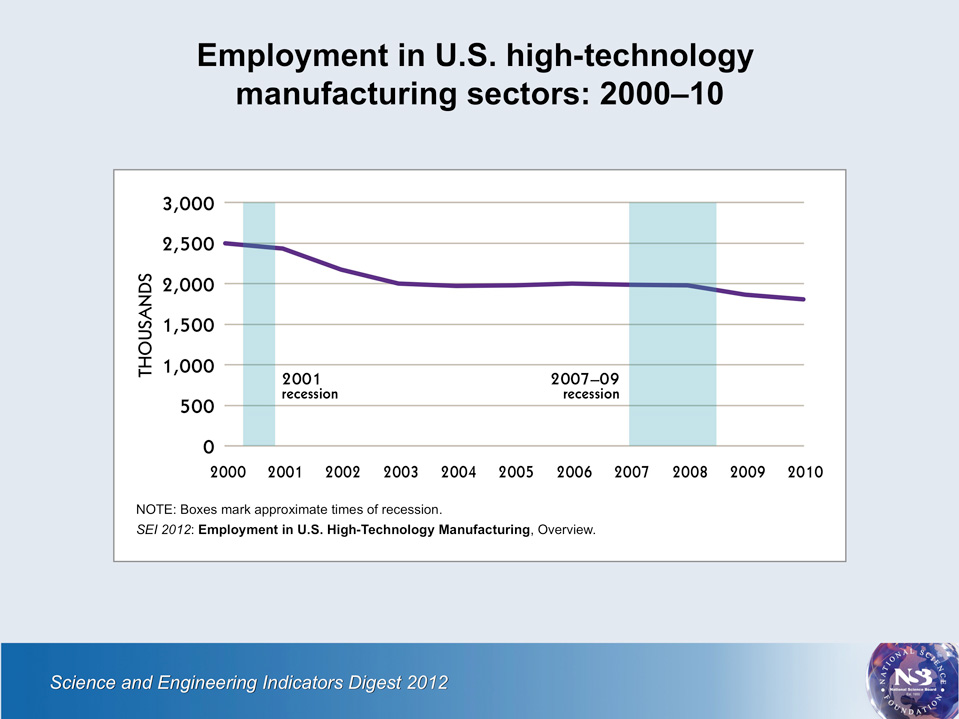
Employment in U.S. high-technology manufacturing sectors: 2000–10

- Excel data
- Powerpoint
- Image
Download:
SEI 2012: Employment in U.S. High-Technology Manufacturing, Overview.
Unemployment
With few exceptions, workers in S&E occupations have for decades had lower unemployment than workers in other kinds of jobs. The unemployment rate for workers in S&E occupations is generally lower than it is for those with bachelor's degrees or higher who work in non-S&E occupations, and it is far lower than the overall unemployment rate.
Nevertheless, recession-induced job losses in sectors of the economy that employ large numbers of scientists and engineers have been severe. High-technology manufacturing has lost 28% of jobs since a 2000 employment high of 2.5 million.
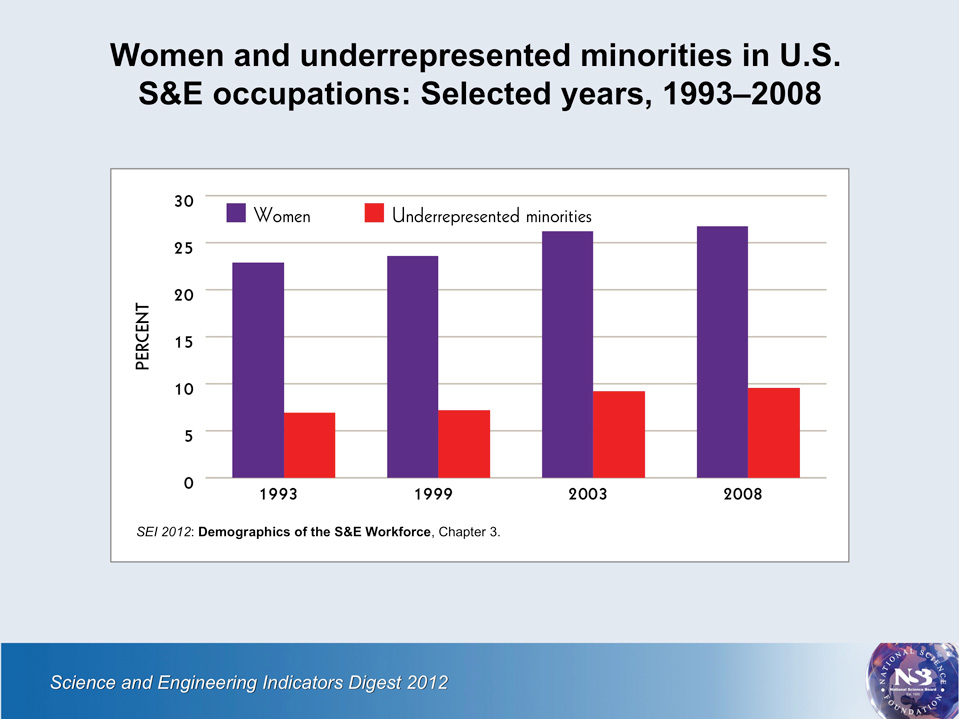
Women and underrepresented minorities in U.S. S&E occupations: selected years,
1993–2008

- Excel data
- Powerpoint
- Image
Download:
Women and underrepresented minorities
Women's representation in the S&E workforce has gradually risen from 23% in 1993 to 27% 15 years later.
Similarly, underrepresented minorities—blacks, Hispanics, and American Indians and Alaska Natives—have made substantial strides, but their representation in S&E jobs remains below their proportion in the population.
In both instances, participation has continued to rise over the last 5 years, but more slowly than in the 1990s.
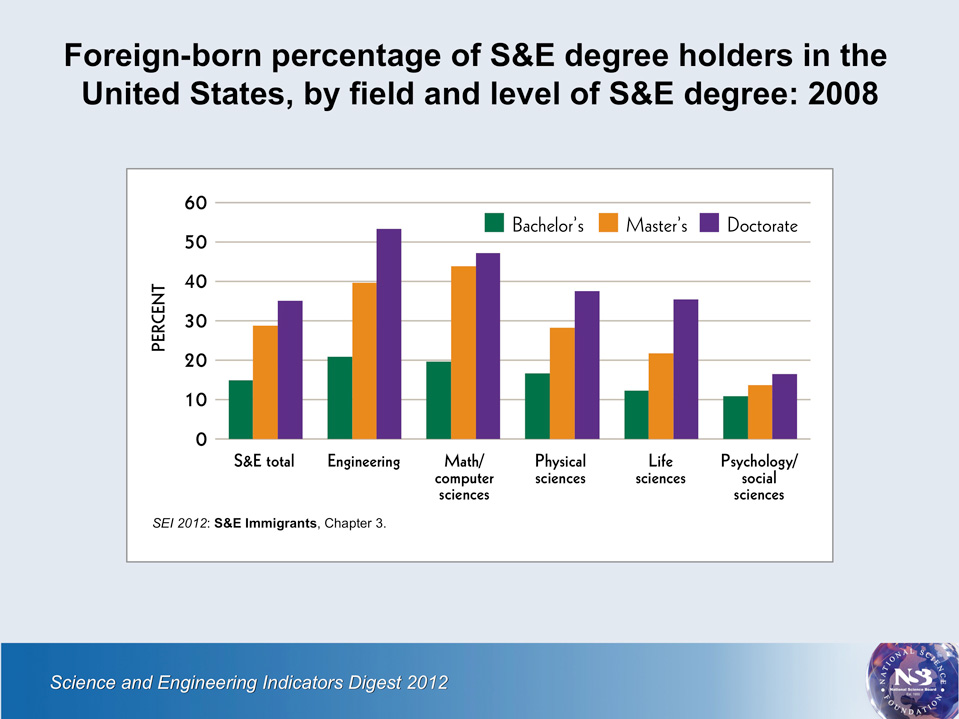
Foreign-born percentage of S&E degree holders in the United States, by field and level of S&E degree: 2008

- Excel data
- Powerpoint
- Image
Download:
Foreign-born scientists and engineers
Foreign-born scientists and engineers, whether educated in the United States or abroad, are a critical part of the U.S. S&E workforce: about one in four S&E master's degree holders and one in three S&E doctorate holders are foreign born. This reliance is greatest on those with engineering and math/computer science degrees. Among them, about 40% of master's degree holders and 50% of doctorate holders are foreign born.
