
All Images
Research News
Supercomputer Simulations to Help Predict Tornadoes
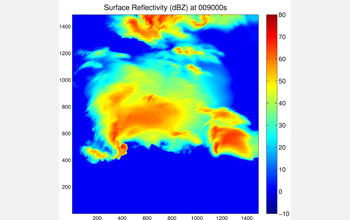
This graph shows the reflectivity at the surface of one of McGovern's team's simulations. Redder colors indicate a region with more intense precipitation. The graph also shows a hook echo region, a region indicative of a tornado, in the southwest quadrant of the simulation.
Credit: Amy McGovern, School of Computer Science, University of Oklahoma
Download the high-resolution JPG version of the image. (1.1 MB)
Use your mouse to right-click (Mac users may need to Ctrl-click) the link above and choose the option that will save the file or target to your computer.
Movie showing the surface reflectivity for an entire simulation. The reflectivity is calculated every 30 seconds. Redder colors indicate a region with more intense precipitation. The tornado appears about 9,000 seconds into the simulation, in the southwest quadrant.
Credit: Amy McGovern, School of Computer Science, University of Oklahoma

This graph shows the corresponding pressure, wind and vorticity measurements at the same time step for the same simulation as shown above. The arrows show the wind field, the contour lines show the pressure gradients, and the colors show the vorticity. Vorticity is a measure of the instantaneous spin. Combined with a dramatic change in pressure, vorticity can be used to confirm the presence of a tornado, which is seen in the same region as the hook echo in the previous graph.
Credit: Amy McGovern, School of Computer Science, University of Oklahoma
Download the high-resolution JPG version of the image. (1.6 MB)
Use your mouse to right-click (Mac users may need to Ctrl-click) the link above and choose the option that will save the file or target to your computer.
Movie showing the pressure, wind and vorticity measurements for the same simulation, measured every 30 seconds.
Credit: Amy McGovern, School of Computer Science, University of Oklahoma