
Multimedia Gallery
 All images in this series
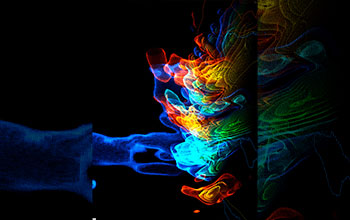
Simulation depicting velocity wavefield beneath Southern California
A Terashake 2.1 simulation depicting a velocity wavefield as it propagates through a 3D velocity structure beneath Southern California. Red and yellow colors indicate regions of compression, while blue and green colors show regions of dilation. Faint yellow (faults), red (roads) and blue (coastline) lines add geographical context.
[Research supported in part by U.S. National Science Foundation grants EAR 0122464 and ANI 0225642.] (Date of Image: July 2006)
Credit: Marcus Thiebaux, Information Sciences Institute, University of Southern California
See other images like this on your iPhone or iPad download NSF Science Zone on the Apple App Store.
Images and other media in the National Science Foundation Multimedia Gallery are available for use in print and electronic material by NSF employees, members of the media, university staff, teachers and the general public. All media in the gallery are intended for personal, educational and nonprofit/non-commercial use only.
Images credited to the National Science Foundation, a federal agency, are in the public domain. The images were created by employees of the United States Government as part of their official duties or prepared by contractors as "works for hire" for NSF. You may freely use NSF-credited images and, at your discretion, credit NSF with a "Courtesy: National Science Foundation" notation.
Additional information about general usage can be found in Conditions.
Also Available:
Download the high-resolution JPG version of the image. (2.0 MB)
Use your mouse to right-click (Mac users may need to Ctrl-click) the link above and choose the option that will save the file or target to your computer.