
Multimedia Gallery
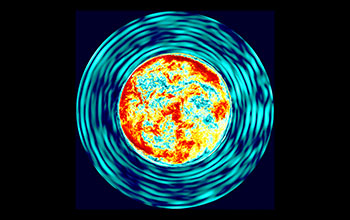
Visualization of a 25 solar mass star, produced by a simulation
A visualization of a 25 solar mass star, captured from a simulation generated by the supercomputer Frontera, depicts the varying velocities produced by the core’s convection, viewed across a thin slice. Faster velocities of gas (red and yellow) are found inside the core, while slower velocities (white and aqua) are found near the surface of the star. The colors clearly distinguish the star’s convective boundaries, which are the regions where the hot gas rises and the cold gas sinks.
[Research supported by U.S. National Science Foundation grants AST 1814181 and OAC 2032010.]
Learn more in the TACC news story Texascale days with Frontera: A win-win for researchers and TACC. (Date of image: 2022; date originally posted to NSF Multimedia Gallery: April 13, 2023)
Credit: Paul Woodward/University of Minnesota
Images and other media in the National Science Foundation Multimedia Gallery are available for use in print and electronic material by NSF employees, members of the media, university staff, teachers and the general public. All media in the gallery are intended for personal, educational and nonprofit/non-commercial use only.
Images credited to the National Science Foundation, a federal agency, are in the public domain. The images were created by employees of the United States Government as part of their official duties or prepared by contractors as "works for hire" for NSF. You may freely use NSF-credited images and, at your discretion, credit NSF with a "Courtesy: National Science Foundation" notation.
Additional information about general usage can be found in Conditions.
Also Available:
Download the high-resolution JPG version of the image. (2.2 MB)
Use your mouse to right-click (Mac users may need to Ctrl-click) the link above and choose the option that will save the file or target to your computer.