
Multimedia Gallery
January 11, 2005
Images credited to the National Science Foundation, a federal agency, are in the public domain. The images were created by employees of the United States Government as part of their official duties or prepared by contractors as "works for hire" for NSF. You may freely use NSF-credited images and, at your discretion, credit NSF with a "Courtesy: National Science Foundation" notation.
Additional information about general usage can be found in Conditions.

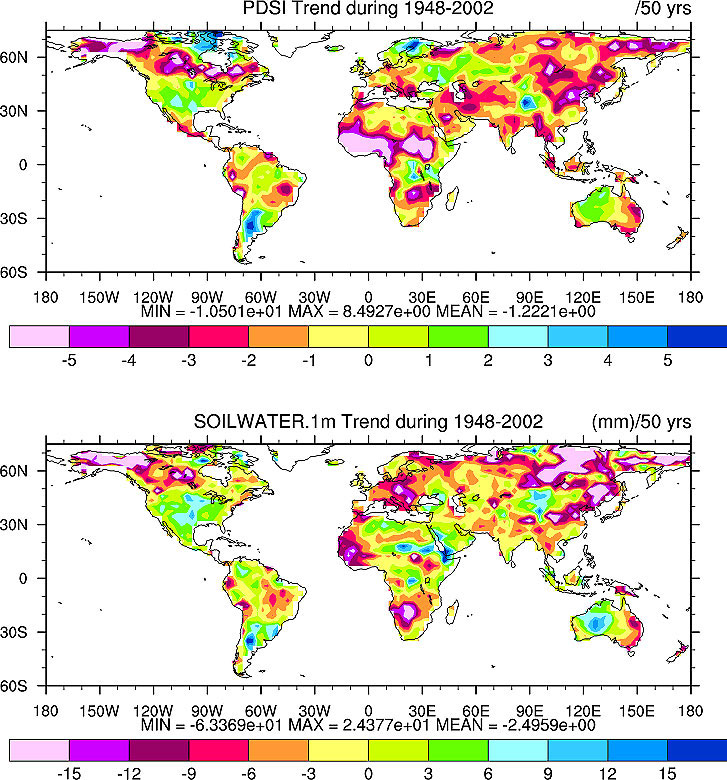
This graph shows depiction of linear trends in the PDSI.
This depiction of linear trends in the Palmer Drought Severe Index (PDSI) from 1948 to 2002 shows drying (reds and pinks) across much of Canada, Europe, Asia, and Africa and moistening (green) across the United States, Argentina, Scandinavia, and western Australia.
Credit: Illustration courtesy A. Dai and the American Meteorological Society
Images credited to the National Science Foundation, a federal agency, are in the public domain. The images were created by employees of the United States Government as part of their official duties or prepared by contractors as "works for hire" for NSF. You may freely use NSF-credited images and, at your discretion, credit NSF with a "Courtesy: National Science Foundation" notation.
Additional information about general usage can be found in Conditions.
Also Available:
Download the high-resolution JPG version of the image. (207 KB)
Use your mouse to right-click (Mac users may need to Ctrl-click) the link above and choose the option that will save the file or target to your computer.
Related story: Scientists Find Climate Change is Major Factor in Drought's Growing Reach