
Multimedia Gallery

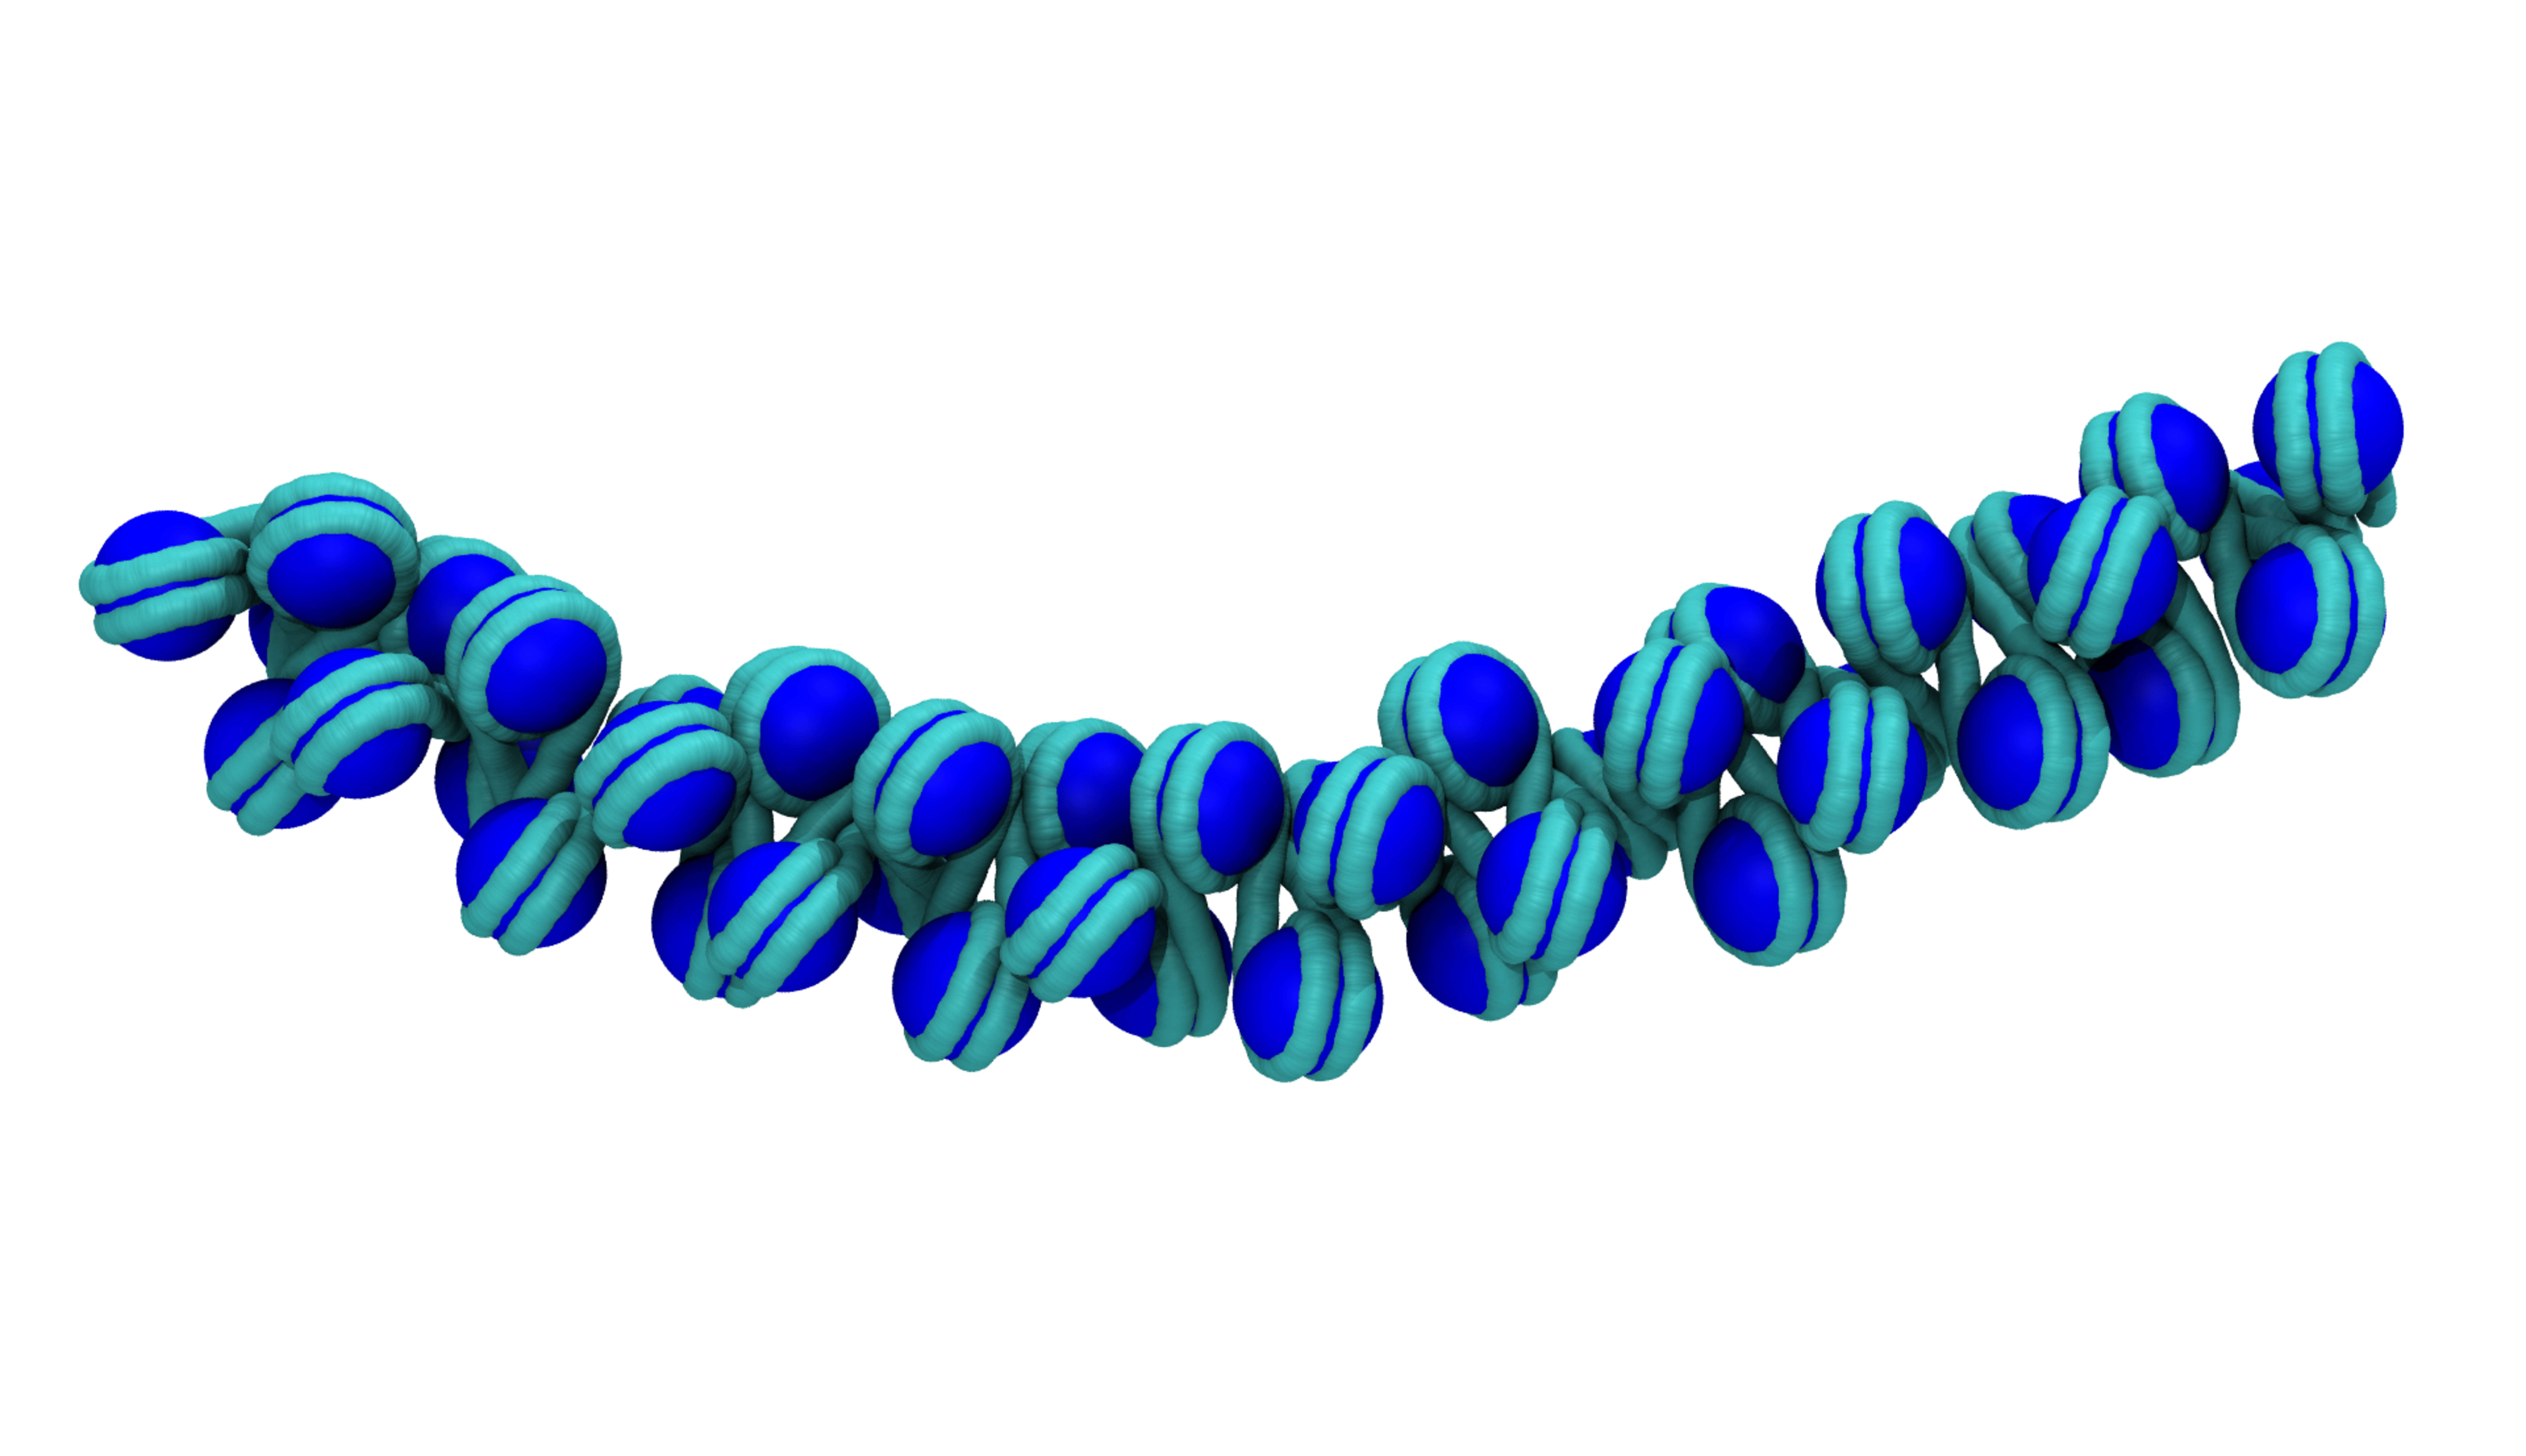
Model of Condensed Chromatin
A model of condensed chromatin in which nucleosomes (blue beads) are closely packed on a length of DNA (tubes). Tight packing limits the range of possible locations for any single nucleosome and thus the fiber assumes a comparatively regular structure. [See related image Here.]
More About This Image
Five tandem repeats of the mouse mammary tumor virus promoter sequence are used to illustrate how DNA sequence affects the structure of chromatin. In this image, the tube-like model represents 7444 base pairs of DNA and the large spheres represent histone octamers. Each octamer wraps about 146 base pairs of DNA into ~1.7 left-handed superhelical turns. The individual histone DNA complexes are termed nucleosomes. Nucleosome formation is the primary molecular mechanism for compacting DNA in eukaryotic organisms.
These images represent two extremes of chromatin structure. At one extreme (blue histones), the sequence has no effect on the location of the individual nucleosomes. The nucleosomes assume a more or less regular spacing along the DNA. This allows for tight packing and optimal nucleosome-nucleosome interaction. In this state it is the sequence-specific properties of the linker DNA between nucleosomes that governs the gross structure of chromatin. For this particular sequence the linker DNA affects an overall bend of the chromatin fiber. At the other extreme (red histones), the DNA sequence dictates nucleosome positioning. In this case the individual histone-DNA free energies are optimized at the expense of nucleosome-nucleosome interactions. The length of linker DNA between nucleosome varies considerably.
The structure shown here corresponds to 70 percent occupancy by nucleosomes. At this level of occupancy the structure is extended, and allows access to other DNA-binding proteins. Long lengths of linker DNA between nucleosomes are sufficiently flexible to avoid steric overlap between nucleosomes. (Minimization not implemented so as to highlight difficulty with positioning based only on sequence.)
A graduate student working on this project and the molecular modeling workflows were funded in part by a grant from the National Science Foundation (EPS 07-01491, "Louisiana's Research Infrastructure Improvement Strategy"). Additional funding was provided by the National Institutes of Health (grant 5R01GM076356) and computer resources through TeraGrid Allocation TG-MCB100111, both awarded to Thomas Bishop of the Center for Computational Science at Tulane University. Simulations done at the National Center for Supercomputing Applications.
To learn more about this research, see the story Getting the Rabbit in the Hat, from the National Center for Supercomputing Applications (NCSA) Access magazine, Summer 2010. (Date of Image: Summer/Fall 2010)
Credit: Thomas C. Bishop, Depts. Chemistry and Physics, Louisiana Tech University (http://www.latech.edu/~bishop)
See other images like this on your iPhone or iPad download NSF Science Zone on the Apple App Store.
Images and other media in the National Science Foundation Multimedia Gallery are available for use in print and electronic material by NSF employees, members of the media, university staff, teachers and the general public. All media in the gallery are intended for personal, educational and nonprofit/non-commercial use only.
Images credited to the National Science Foundation, a federal agency, are in the public domain. The images were created by employees of the United States Government as part of their official duties or prepared by contractors as "works for hire" for NSF. You may freely use NSF-credited images and, at your discretion, credit NSF with a "Courtesy: National Science Foundation" notation.
Additional information about general usage can be found in Conditions.
Also Available:
Download the high-resolution JPG version of the image. (1.5 MB)
Use your mouse to right-click (Mac users may need to Ctrl-click) the link above and choose the option that will save the file or target to your computer.