All Images
News Release 06-034
Science Leaders Cite a "Changed World" in Call for Bold Efforts to Improve K-12 Science and Mathematics Education
Advisors worry students will not be prepared to help U.S. keep its competitive edge
Back to article | Note about images
 |
Science and Engineering Indicators 2006. |
 |
America's Pressing Challenge - Building a Stronger Foundation. |
 |
Report of the National Assessment for Educational Progress (NAEP) 2005. |
 |
By percentage, where the world's high-technology manufacturing is located. EU-15 is the European Union. Asia-8 includes South Korea, India, Indonesia, Malaysia, Phillipines, Singapore, Taiwan and Thailand. |
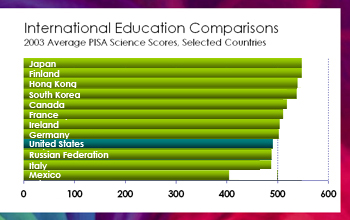 |
Scores for the 2003 Program for International Student Assessment (PISA) tests, which measured students' ability to apply scientific and mathematical concepts and skills. The test was administered to U.S. 15-year-olds. U.S. students scored below the international average. |
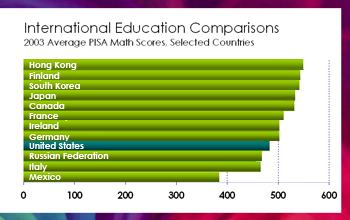 |
Scores for the 2003 Program for International Student Assessment (PISA) tests, which measured students' ability to apply scientific and mathematical concepts and skills. The test was administered to U.S. 15-year-olds. U.S. students scored below the international average. |
 |
The U.S. percentage of the total number of first degrees in natural science and engineering (NS&E), relative to other countries. NS&E does not include the social sciences. |