
What other degree majors require a substantial load of S&E courses?
- Notes:
- S&E = science and engineering. S&E includes biological/agricultural sciences, physical sciences, computer sciences, mathematics/statistics, engineering, psychology, and social sciences. Physical sciences = chemistry, physics, astronomy, and earth/atmospheric/ocean sciences.
- S&E-related = health sciences, health technologies, engineering technologies, and other S&E-related technologies.
Special Note on Data Comparability: The chart on doctoral degrees shows a shorter time series than the charts for the other degree levels because, as of 2010, the doctoral degree data for the S&E-related field of health sciences/technologies no longer include some of the more applied types of doctorates. When comparing 2010 and 2012 (using the new S&E-related definition), the data show a 10% increase in health sciences/technologies doctorates over the 3-year period, from 4,175 doctorates in 2010 to 4,602 doctorates in 2012. This is a larger percentage increase than for S&E doctorates, which grew 8% over the period, from 32,649 in 2010 to 35,360 in 2012.
- Source:
- National Center for Education Statistics, Integrated Postsecondary Education Data System, Completions Survey; and National Science Foundation, National Center for Science and Engineering Statistics, WebCASPAR database, https://webcaspar.nsf. gov, detailed queries for Women, Minorities, and Persons with Disabilities, tables 4-1, 5-2, 6-1, and 7-1.
- Notes:
- S&E = science and engineering. S&E includes biological/agricultural sciences, physical sciences, computer sciences, mathematics/statistics, engineering, psychology, and social sciences. Physical sciences = chemistry, physics, astronomy, and earth/atmospheric/ocean sciences.
- S&E-related = health sciences, health technologies, engineering technologies, and other S&E-related technologies.
- Source:
- National Center for Education Statistics, Integrated Postsecondary Education Data System, Completions Survey; and National Science Foundation, National Center for Science and Engineering Statistics, WebCASPAR database, https://webcaspar.nsf. gov, detailed queries for Women, Minorities, and Persons with Disabilities, tables 4-1, 5-2, 6-2, and 7-3.
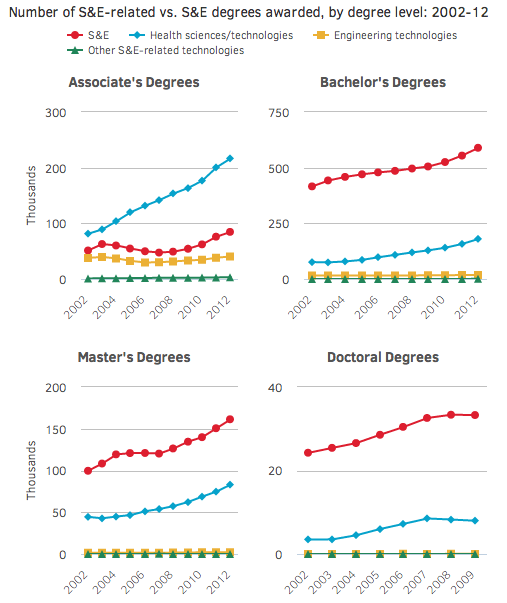
Large numbers of students major in health sciences, health technologies, engineering technologies, and other technologies. Although the National Science Foundation considers these fields to be “S&E-related” rather than S&E and does not include S&E-related degrees in the S&E data, majors in these fields require a substantial load of S&E courses in the biological sciences, engineering, mathematics/statistics, and/or computer sciences. Health sciences/technologies is the most prominent area among the S&E-related fields, and the growth in the number of degrees earned in health sciences/technologies has far outpaced the growth in the number of S&E degrees awarded in the last decade.
Women earn a large majority of the degrees in health sciences/technologies at every degree level, while men generally earn a large majority of the degrees in engineering technologies and other S&E-related technologies. Women now outnumber men in S&E degrees at the bachelor’s level, but men continue to receive a majority of S&E degrees at the associate’s, master’s, and doctoral levels.
Key Observations
- S&E-related degrees are most notable, relative to S&E degrees, at the associate’s degree level. This is particularly true for health sciences/technologies, which in 2012, accounted for 2.6 times more associate’s degrees (216,794) than were awarded in S&E fields (84,641).
- At the higher degree levels, S&E degrees outnumbered health sciences/technologies degrees. S&E fields accounted for 3.3 times more bachelor’s degrees than were awarded in health sciences/technologies in 2012: 589,330 vs. 180,008. At the master’s level in 2012, the number of S&E degrees (161,371) was close to double the number of degrees in health sciences/technologies (83,154).
- In 2009 - the latest year in which comparable doctoral data exist – the number of S&E doctorates awarded (33,284) was 4.2 times the number awarded in health sciences/technologies (7,966).
- At every degree level, health sciences/technologies outpaced S&E in terms of the percentage increase in the number of degree awards: a 167% vs. 65% increase in the number of associate’s degrees between 2002 and 2012; a 137% vs. 42% increase in the number of bachelor’s degrees; a 87% vs. 62% increase in the number of master’s degrees; and (from 2002 to 2009) a 129% vs. 37% increase in the number of doctoral degrees.
- Far fewer degrees are awarded in engineering technologies. In 2012, there were 40,609 engineering technologies degrees conferred at the associate’s level; 18,231 at the bachelor’s level; 2,159 at the master’s level; and 81 at the doctoral level.
- In 2012, women received 84% of all associate’s degrees awarded in health sciences/technologies (182,366 vs. men’s 34,428). On the other hand, men accounted for 88% of all degrees awarded in engineering technologies (35,697 vs. women’s 4,912), and 58% of all S&E degrees (48,776 vs. women’s 35,865). Men also received 67% of the 3,225 associate’s degrees awarded in “other S&E-related technologies” in 2012.
- At the bachelor’s level in 2012, women accounted for a slight majority (50.5%) of all S&E degrees (297,539 vs. men’s 291,791) and a large majority (82%) of the degrees in health sciences/technologies (147,921 vs. men’s 32,087). Men earned 88% of all bachelor’s degrees in engineering technologies (16,062 vs. women’s 2,169). Men also received 58% of the 654 bachelor’s degrees awarded in “other S&E-related technologies
- At the master’s level in 2012, women received 81% of all degrees awarded in health sciences/technologies (67,108 vs. men’s 16,046). Men accounted for 71% of all engineering technologies degrees (1,528 vs. women’s 631) and 54% of all S&E degrees (87,810 vs. women’s 73,561). Men also received 59% of the 70 master’s degrees awarded in “other S&E-related technologies.
- At the doctoral level in 2012, women earned 71% of all doctorates awarded in health sciences/technologies (3,280 vs. men’s 1,322) and 58% of the doctorates in engineering technologies (47 vs. men’s 34). Men received 59% of all S&E doctorates (20,836 vs. women’s 14,524) and the one doctorate awarded in “other S&E-related technologies.


 @NSF_NSB
 NSB
NSB