

Postdocs
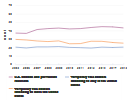
From 2005 to 2015, temporary visa holders intending to stay in the United States after earning a doctorate were more likely to take a postdoc position within the year following graduation than were temporary visa holders intending to leave and U.S. citizen and permanent resident doctorate recipients. Among temporary visa holders intending to stay and reporting definite postgraduation commitments for either a postdoc or employed position, the proportion of these graduates committing to a postdoc fluctuated around 50%, reaching a high of 59% in 2010. Among temporary visa holders intending to leave, the share committing to a postdoc position outside the United States increased over the 10 years but never exceeded 40%, and the same is true for the postdoc commitment rate of U.S. citizens and permanent residents (figure E).
Postdoc rate of U.S. doctorate recipients, by resident type: 2005–15

| Year | All doctorate recipients | U.S. citizens and permanent residents | Temporary visa holders intending to stay in the United States | Temporary visa holders intending to leave the United States |
|---|---|---|---|---|
| 2005 | 35.5 | 31.9 | 50.8 | 24.8 |
| 2006 | 33.9 | 30.9 | 45.0 | 25.2 |
| 2007 | 36.2 | 32.9 | 46.4 | 31.0 |
| 2008 | 35.8 | 32.6 | 45.6 | 32.3 |
| 2009 | 37.9 | 34.4 | 49.5 | 34.5 |
| 2010 | 42.9 | 38.9 | 59.4 | 34.1 |
| 2011 | 42.7 | 39.4 | 55.9 | 33.8 |
| 2012 | 40.2 | 37.7 | 50.4 | 31.8 |
| 2013 | 39.4 | 36.9 | 48.9 | 34.2 |
| 2014 | 39.4 | 37.3 | 47.3 | 35.0 |
| 2015 | 39.7 | 37.5 | 48.3 | 33.8 |
- NOTE: Percentages are based on the number of doctorate recipients who reported definite postgraduation commitments for a postdoc or other employment in the coming year.
- SOURCE: Doctorate Recipients from U.S. Universities 2015. Related detailed data: tables 44, 51, 52.