


Postdoc positions
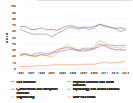
Historically, postdoc positions have been a customary part of the early career paths of doctoral scientists in life sciences and in physical and earth sciences, and they have also become increasingly prevalent among recent doctoral graduates in mathematics and computer sciences, psychology and social sciences, and engineering. However, since 2010, the proportion of doctorate recipients taking postdoc positions in the United States has declined in every S&E field but psychology and social sciences. Still, nearly two-thirds of 2015 doctoral graduates in life sciences took postdoc positions immediately after graduation, as did nearly half of all S&E doctorate recipients (figure D).
U.S. postdoc rate for U.S. doctorate recipients, by broad field of study: 1995–2015

| Field | All fields | S&E fields | Life sciences | Physical sciences and earth sciences | Mathematics and computer sciences | Psychology and social sciences | Engineering | Non-S&E fields |
|---|---|---|---|---|---|---|---|---|
| 1995 | 30.0 | 44.4 | 67.7 | 64.1 | 22.1 | 22.3 | 25.9 | 4.1 |
| 1996 | 29.9 | 43.4 | 68.0 | 59.7 | 24.8 | 23.0 | 23.1 | 3.8 |
| 1997 | 28.7 | 40.6 | 63.0 | 56.5 | 21.1 | 21.8 | 21.2 | 4.0 |
| 1998 | 29.3 | 40.8 | 63.4 | 55.5 | 20.9 | 25.1 | 19.4 | 5.2 |
| 1999 | 30.4 | 42.9 | 65.9 | 56.1 | 23.5 | 26.3 | 22.6 | 5.4 |
| 2000 | 28.9 | 41.0 | 62.7 | 55.6 | 21.9 | 24.8 | 21.3 | 5.1 |
| 2001 | 29.2 | 40.5 | 63.5 | 51.6 | 24.5 | 26.8 | 18.8 | 6.8 |
| 2002 | 30.7 | 43.3 | 61.7 | 56.8 | 30.9 | 27.1 | 25.6 | 6.8 |
| 2003 | 33.3 | 47.3 | 65.6 | 60.7 | 33.2 | 28.8 | 33.9 | 6.8 |
| 2004 | 35.8 | 50.8 | 69.4 | 65.9 | 34.3 | 31.0 | 38.5 | 6.8 |
| 2005 | 35.9 | 49.4 | 68.6 | 66.0 | 32.8 | 30.8 | 34.1 | 7.2 |
| 2006 | 34.0 | 46.5 | 66.1 | 63.5 | 28.9 | 30.1 | 30.0 | 6.5 |
| 2007 | 35.9 | 48.1 | 66.9 | 65.7 | 28.8 | 33.2 | 31.5 | 7.4 |
| 2008 | 35.4 | 47.3 | 66.5 | 63.3 | 30.2 | 33.2 | 30.1 | 7.6 |
| 2009 | 37.4 | 49.5 | 67.7 | 65.0 | 31.8 | 33.0 | 35.7 | 7.5 |
| 2010 | 43.0 | 55.2 | 70.9 | 72.2 | 39.7 | 35.2 | 46.1 | 9.4 |
| 2011 | 42.7 | 53.5 | 70.2 | 67.7 | 37.4 | 38.5 | 41.4 | 10.5 |
| 2012 | 40.1 | 50.4 | 67.2 | 66.6 | 33.2 | 38.3 | 35.5 | 9.4 |
| 2013 | 39.1 | 48.8 | 65.0 | 64.9 | 31.2 | 37.5 | 35.1 | 10.0 |
| 2014 | 38.9 | 47.6 | 65.8 | 60.2 | 30.6 | 37.2 | 33.3 | 10.9 |
| 2015 | 39.3 | 47.9 | 64.1 | 62.3 | 30.5 | 38.2 | 35.3 | 12.2 |
- S&E = science and engineering.
- NOTE: Percentages are based on the number of doctorate recipients who reported definite postgraduation commitments for a postdoc or other employment in the coming year and plans to stay in the United States.
- SOURCE: Doctorate Recipients from U.S. Universities 2015. Related detailed data: tables 44, 51, 52.