


By race and ethnicity
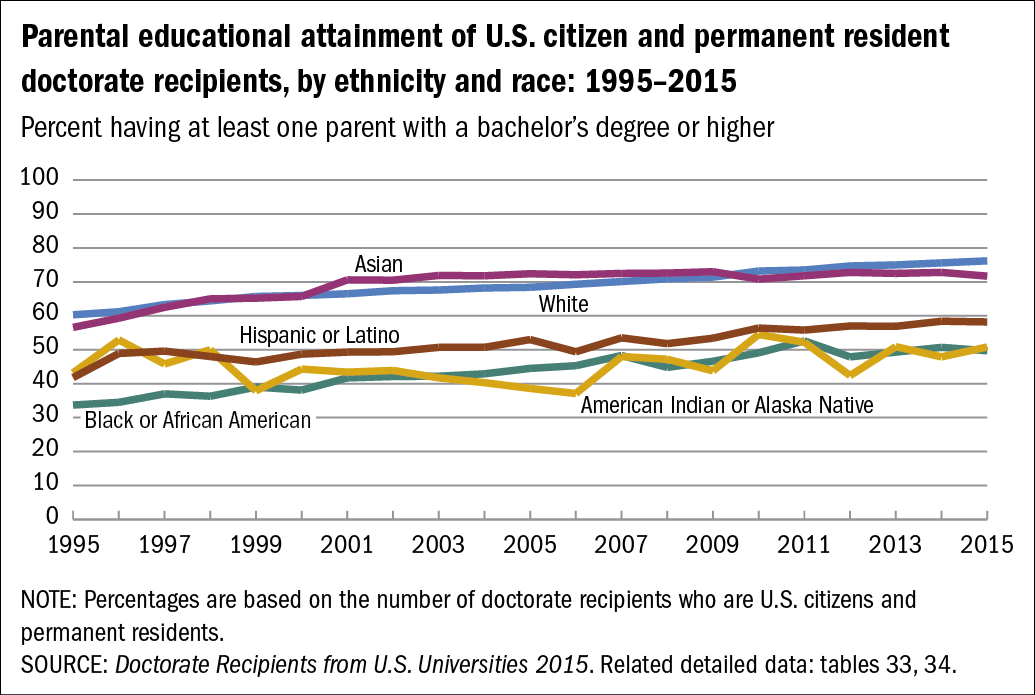
The pattern of rising parental educational attainment is visible among all races and ethnicities for U.S. citizen and permanent resident doctorate recipients. Nonetheless, doctorate recipients from underrepresented minority groups are less likely to have at least one parent with a bachelor's degree than are Asian or white doctorate recipients.
As of 2015, approximately half of American Indian or Alaska Native and black or African American doctorate recipients and more than 40% of Hispanic or Latino doctorate recipients belonged to families in which neither parent had been awarded a college degree. In comparison, fewer than 30% of Asian and white doctorate recipients came from families in which neither parent had been awarded a college degree (figure B).
Parental educational attainment of U.S. citizen and permanent resident doctorate recipients, by ethnicity and race: 1995–2015
| Year | All ethnicities and races | Hispanic or Latino | Not Hispanic or Latino | Ethnicity not reported | |||||
|---|---|---|---|---|---|---|---|---|---|
| American Indian or Alaska Native | Asian | Black or African American | White | Two or more races | Other race or race not reported | ||||
| 1995 | 58.1 | 41.8 | 43.2 | 56.6 | 33.7 | 60.3 | na | 52.8 | 75.7 |
| 1996 | 59.3 | 48.9 | 52.9 | 59.3 | 34.5 | 61.2 | na | 62.6 | 63.1 |
| 1997 | 61.4 | 49.6 | 45.8 | 62.5 | 37.0 | 63.3 | na | 65.6 | 75.7 |
| 1998 | 62.3 | 48.0 | 50.0 | 65.0 | 36.3 | 64.4 | na | 66.8 | 65.3 |
| 1999 | 63.2 | 46.4 | 37.9 | 65.2 | 39.0 | 65.7 | na | 67.5 | 67.7 |
| 2000 | 63.6 | 48.7 | 44.3 | 65.7 | 38.1 | 66.0 | na | 70.4 | 73.4 |
| 2001 | 64.5 | 49.3 | 43.4 | 70.6 | 41.7 | 66.5 | 66.6 | 71.0 | 59.5 |
| 2002 | 65.0 | 49.4 | 43.9 | 70.5 | 42.1 | 67.4 | 66.5 | 65.5 | 62.6 |
| 2003 | 65.4 | 50.7 | 41.7 | 71.9 | 42.2 | 67.6 | 66.6 | 69.0 | 66.3 |
| 2004 | 65.8 | 50.7 | 40.3 | 71.8 | 42.9 | 68.2 | 66.7 | 72.9 | 62.4 |
| 2005 | 66.3 | 53.0 | 38.6 | 72.4 | 44.5 | 68.4 | 66.4 | 73.2 | 65.8 |
| 2006 | 67.0 | 49.4 | 37.1 | 72.1 | 45.3 | 69.3 | 69.6 | 70.9 | 69.4 |
| 2007 | 67.8 | 53.5 | 48.0 | 72.5 | 48.3 | 70.1 | 68.6 | 71.5 | 64.3 |
| 2008 | 68.2 | 51.8 | 47.2 | 72.6 | 44.8 | 70.9 | 70.6 | 71.5 | 64.9 |
| 2009 | 68.8 | 53.4 | 43.8 | 73.0 | 46.6 | 71.4 | 68.9 | 69.7 | 75.5 |
| 2010 | 70.4 | 56.4 | 54.5 | 70.8 | 49.1 | 73.2 | 70.9 | 71.4 | 73.0 |
| 2011 | 70.9 | 55.8 | 52.2 | 71.8 | 52.6 | 73.5 | 73.1 | 68.1 | 70.9 |
| 2012 | 71.6 | 57.0 | 42.4 | 72.8 | 47.9 | 74.7 | 73.8 | 77.9 | 73.6 |
| 2013 | 72.0 | 56.9 | 50.9 | 72.5 | 49.3 | 75.0 | 76.3 | 79.6 | 69.3 |
| 2014 | 72.5 | 58.4 | 47.9 | 72.8 | 50.7 | 75.6 | 73.2 | 77.6 | 74.3 |
| 2015 | 72.6 | 58.2 | 50.8 | 71.7 | 49.7 | 76.2 | 72.0 | 74.4 | 64.2 |
NOTE: Percentages are based on the number of doctorate recipients who are U.S. citizens and permanent residents.
- SOURCE: Doctorate Recipients from U.S. Universities 2015. Related detailed data: tables 33, 34.