


Overview
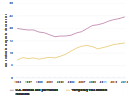
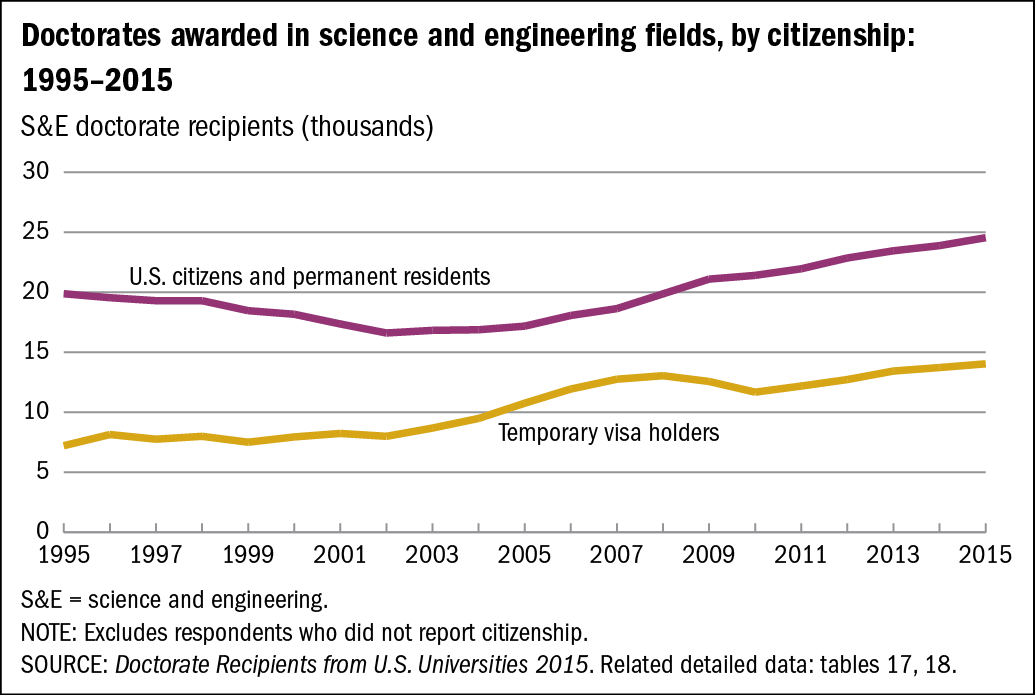
The number of doctorates in S&E fields awarded to temporary visa holders grew to 14,037 in 2015, up 30% since 2005 but up only 2% since 2014. In comparison, the number of S&E doctorates awarded to U.S. citizens and permanent residents grew 43% since 2005 and 3% since 2014.
In 1995, 27% of all S&E doctorates were awarded to temporary visa holders. The proportion of S&E doctorate recipients with temporary visas increased to a peak of 41% in 2007 and has held steady at 36% since 2011 (figure B).
Over the 5-year period 2011 to 2015, 86% of the doctorates earned by temporary visa holders were in S&E fields, compared with 70% of the doctorates earned by U.S. citizens and permanent residents.
Doctorates awarded in science and engineering fields, by citizenship: 1995–2015
| Year | U.S. citizens and permanent residents | Temporary visa holders |
|---|---|---|
| 1995 | 19,882 | 7,223 |
| 1996 | 19,548 | 8,146 |
| 1997 | 19,300 | 7,761 |
| 1998 | 19,302 | 8,004 |
| 1999 | 18,472 | 7,505 |
| 2000 | 18,173 | 7,950 |
| 2001 | 17,361 | 8,244 |
| 2002 | 16,608 | 8,000 |
| 2003 | 16,832 | 8,685 |
| 2004 | 16,879 | 9,494 |
| 2005 | 17,177 | 10,761 |
| 2006 | 18,073 | 11,941 |
| 2007 | 18,635 | 12,762 |
| 2008 | 19,869 | 13,045 |
| 2009 | 21,103 | 12,571 |
| 2010 | 21,406 | 11,675 |
| 2011 | 21,964 | 12,185 |
| 2012 | 22,858 | 12,729 |
| 2013 | 23,463 | 13,435 |
| 2014 | 23,889 | 13,728 |
| 2015 | 24,547 | 14,037 |
S&E = science and engineering.
NOTE: Excludes respondents who did not report citizenship.
- SOURCE: Doctorate Recipients from U.S. Universities 2015. Related detailed data: tables 17, 18.