


Field of study
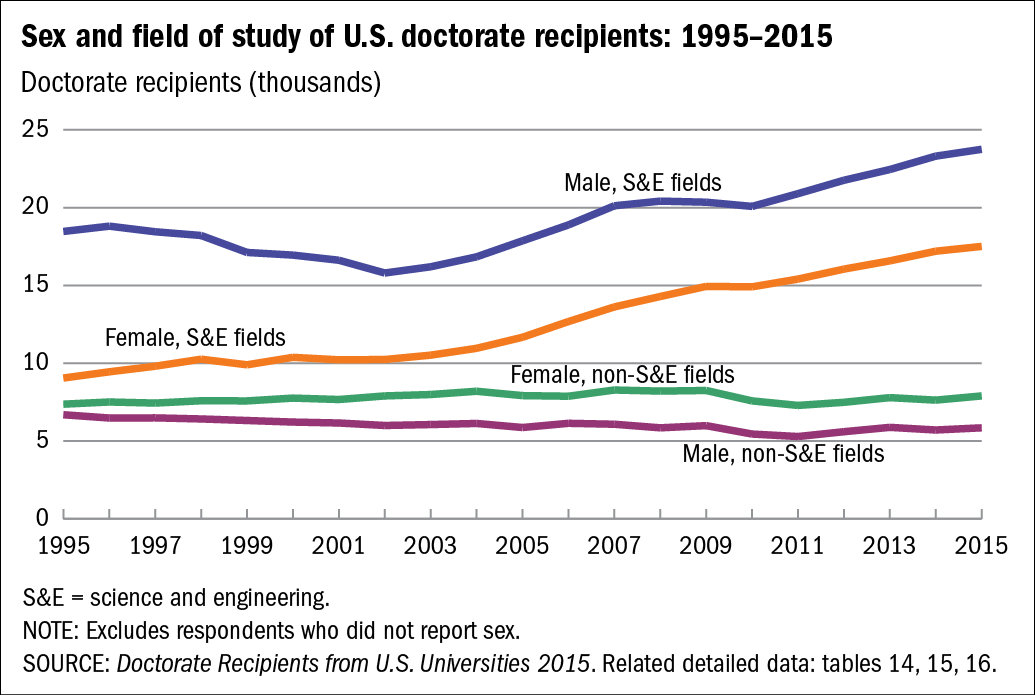
Most of the growth in the number of doctorates earned by both men and women has been in S&E fields. From 1995 to 2015, the number of female doctorate recipients in S&E fields increased by 93%, far faster than the 29% growth in the number of male S&E doctorates. The numbers of male doctorate recipients and female doctorate recipients in S&E fields both grew by 2% from 2014 to 2015. Although women's share of S&E doctorates awarded increased from 33% in 1995 to 42% in 2009, it has remained stable since then.
The number of female doctorate recipients in non-S&E fields has grown at a slower pace (7%) over the past 20 years, whereas the number of male doctorates in those fields has declined by 13%. In 2015, 57% of doctorates in non-S&E fields were awarded to women, a share that has changed little since 2002 (figure E).
Sex and field of study of U.S. doctorate recipients: 1995–2015
| Year | Male, S&E fields | Male, non-S&E fields | Female, S&E fields | Female, non-S&E fields |
|---|---|---|---|---|
| 1995 | 18,474 | 6,686 | 9,051 | 7,365 |
| 1996 | 18,812 | 6,476 | 9,450 | 7,506 |
| 1997 | 18,452 | 6,490 | 9,806 | 7,436 |
| 1998 | 18,210 | 6,419 | 10,261 | 7,586 |
| 1999 | 17,118 | 6,320 | 9,904 | 7,581 |
| 2000 | 16,945 | 6,220 | 10,376 | 7,755 |
| 2001 | 16,622 | 6,158 | 10,220 | 7,667 |
| 2002 | 15,802 | 6,004 | 10,236 | 7,904 |
| 2003 | 16,196 | 6,060 | 10,518 | 7,989 |
| 2004 | 16,836 | 6,129 | 10,957 | 8,198 |
| 2005 | 17,869 | 5,868 | 11,665 | 7,917 |
| 2006 | 18,886 | 6,135 | 12,676 | 7,883 |
| 2007 | 20,120 | 6,082 | 13,622 | 8,282 |
| 2008 | 20,420 | 5,852 | 14,289 | 8,205 |
| 2009 | 20,347 | 5,985 | 14,937 | 8,250 |
| 2010 | 20,076 | 5,450 | 14,912 | 7,577 |
| 2011 | 20,903 | 5,288 | 15,413 | 7,288 |
| 2012 | 21,763 | 5,602 | 16,045 | 7,486 |
| 2013 | 22,449 | 5,879 | 16,575 | 7,792 |
| 2014 | 23,312 | 5,706 | 17,195 | 7,627 |
| 2015 | 23,751 | 5,845 | 17,505 | 7,898 |
S&E = science and engineering.
NOTE: Excludes respondents who did not report sex.
- SOURCE: Doctorate Recipients from U.S. Universities 2015. Related detailed data: tables 14, 15, 16.