Characteristics of doctorate recipients
Fields of study
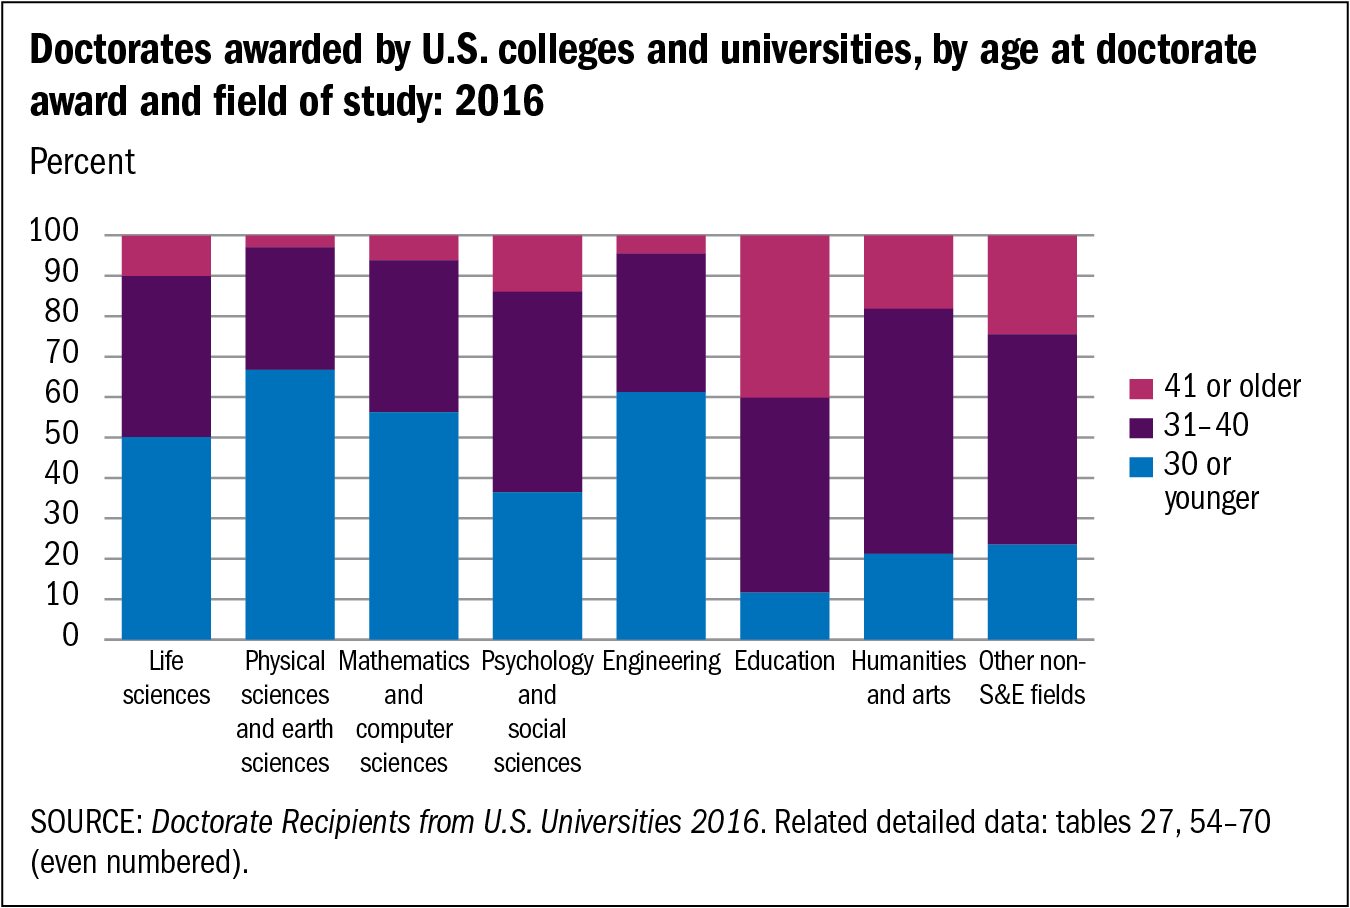
Doctorate recipients in different fields of study had different age distributions at the time of degree completion. In 2016, at least one-half of the doctorate recipients in life sciences, physical sciences and earth sciences, mathematics and computer sciences, and engineering completed their degrees at age 30 or younger, whereas 10% or less finished their degrees at age 41 or older. Education doctorate recipients were more likely than recipients in other fields to be older: 40% earned doctorates at age 41 or older and only 12% received doctorates at age 30 or younger. The majority of doctorate recipients in humanities and arts (61%) and other non-science and engineering fields (52%) earned their degrees between the ages of 31 and 40.
Doctorates awarded by U.S. colleges and universities, by age at doctorate award and field of study: 2016
| Age at doctorate | Life sciences | Physical sciences and earth sciences | Mathematics and computer sciences | Psychology and social sciences | Engineering | Education | Humanities and arts | Other non-S&E fields | ||||||||
|---|---|---|---|---|---|---|---|---|---|---|---|---|---|---|---|---|
| Number | Percent | Number | Percent | Number | Percent | Number | Percent | Number | Percent | Number | Percent | Number | Percent | Number | Percent | |
| 30 or younger | 5,988 | 50.1 | 3,963 | 66.7 | 2,087 | 56.2 | 3,088 | 36.4 | 5,466 | 61.2 | 554 | 11.6 | 1,082 | 21.2 | 635 | 23.5 |
| 31–40 | 4,755 | 39.8 | 1,803 | 30.3 | 1,399 | 37.6 | 4,210 | 49.6 | 3,059 | 34.3 | 2,307 | 48.2 | 3,100 | 60.6 | 1,405 | 52.0 |
| 41 or older | 1,200 | 10.0 | 177 | 3.0 | 230 | 6.2 | 1,190 | 14.0 | 406 | 4.5 | 1,923 | 40.2 | 932 | 18.2 | 662 | 24.5 |
- SOURCE: Doctorate Recipients from U.S. Universities 2016. Related detailed data: tables 27, 54–70 (even numbered).