Overall Trends
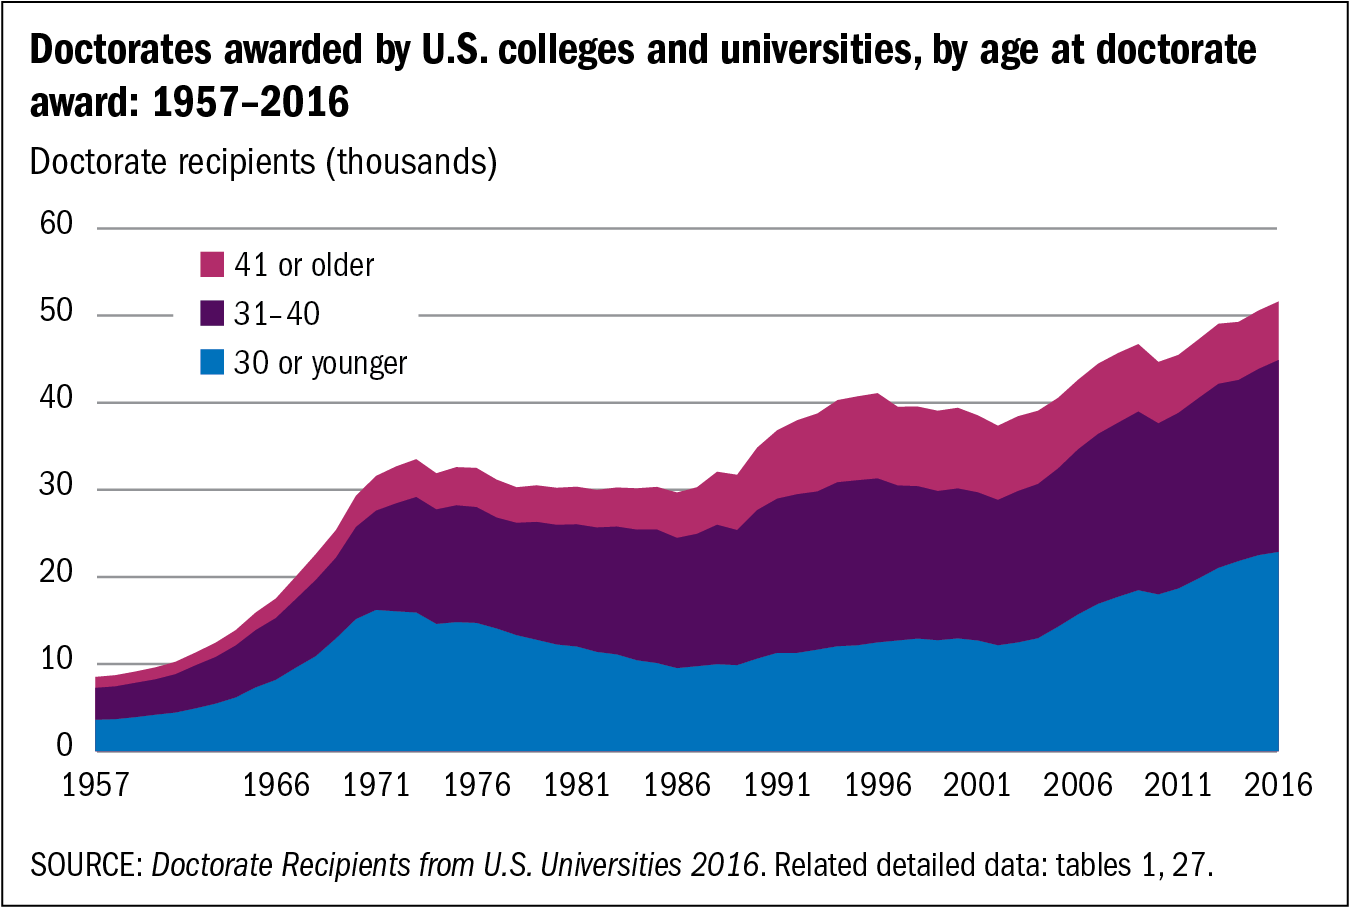
The steep increase in the number of doctorate recipients from 1957 to 1972 was led by those age 30 or younger at the time of doctorate award, whose annual growth rate averaged 11%, whereas both the 31–40 age group and the 41 and older age group had average annual growth rates of 9%. From 1973 to 2001, the number of recipients age 41 or older at the time of graduation grew the fastest, at a 3% average annual growth rate, versus 1% for those age 31 to 40 years, and an average decline by 1% for those age 30 or younger. Since 2002, those age 30 or younger have again dominated the growth in the number of doctorate recipients, with an average annual growth rate of 4%, versus 2% for those age 31 to 40 and a decline of 2% for those age 41 or older.
Doctorates awarded by U.S. colleges and universities, by age at doctorate award: 1957–2016
| Year | 30 or younger | 31–40 | 41 or older |
|---|---|---|---|
| 1957 | 3,589 | 3,667 | 1,261 |
| 1958 | 3,656 | 3,771 | 1,287 |
| 1959 | 3,893 | 3,950 | 1,296 |
| 1960 | 4,172 | 4,073 | 1,375 |
| 1961 | 4,417 | 4,409 | 1,430 |
| 1962 | 4,902 | 4,951 | 1,470 |
| 1963 | 5,439 | 5,355 | 1,654 |
| 1964 | 6,153 | 5,970 | 1,772 |
| 1965 | 7,311 | 6,583 | 2,027 |
| 1966 | 8,171 | 7,101 | 2,254 |
| 1967 | 9,566 | 7,882 | 2,596 |
| 1968 | 10,895 | 8,758 | 2,967 |
| 1969 | 12,920 | 9,279 | 3,175 |
| 1970 | 15,149 | 10,579 | 3,595 |
| 1971 | 16,196 | 11,403 | 3,988 |
| 1972 | 16,038 | 12,395 | 4,238 |
| 1973 | 15,895 | 13,259 | 4,348 |
| 1974 | 14,593 | 13,146 | 4,146 |
| 1975 | 14,798 | 13,414 | 4,386 |
| 1976 | 14,707 | 13,301 | 4,503 |
| 1977 | 14,072 | 12,739 | 4,359 |
| 1978 | 13,296 | 12,902 | 4,089 |
| 1979 | 12,771 | 13,536 | 4,203 |
| 1980 | 12,227 | 13,741 | 4,255 |
| 1981 | 12,001 | 14,034 | 4,323 |
| 1982 | 11,379 | 14,291 | 4,315 |
| 1983 | 11,085 | 14,678 | 4,486 |
| 1984 | 10,421 | 14,997 | 4,753 |
| 1985 | 10,096 | 15,327 | 4,904 |
| 1986 | 9,517 | 14,952 | 5,220 |
| 1987 | 9,743 | 15,197 | 5,351 |
| 1988 | 9,974 | 16,005 | 6,089 |
| 1989 | 9,863 | 15,507 | 6,345 |
| 1990 | 10,606 | 17,059 | 7,171 |
| 1991 | 11,274 | 17,708 | 7,860 |
| 1992 | 11,269 | 18,215 | 8,502 |
| 1993 | 11,644 | 18,156 | 8,953 |
| 1994 | 12,028 | 18,825 | 9,428 |
| 1995 | 12,139 | 18,946 | 9,625 |
| 1996 | 12,466 | 18,833 | 9,787 |
| 1997 | 12,690 | 17,803 | 9,037 |
| 1998 | 12,908 | 17,502 | 9,141 |
| 1999 | 12,722 | 17,126 | 9,224 |
| 2000 | 12,933 | 17,217 | 9,261 |
| 2001 | 12,688 | 17,007 | 8,835 |
| 2002 | 12,140 | 16,690 | 8,524 |
| 2003 | 12,465 | 17,384 | 8,586 |
| 2004 | 12,952 | 17,713 | 8,410 |
| 2005 | 14,273 | 18,174 | 8,109 |
| 2006 | 15,692 | 18,953 | 7,988 |
| 2007 | 16,904 | 19,509 | 8,067 |
| 2008 | 17,707 | 19,989 | 8,003 |
| 2009 | 18,464 | 20,509 | 7,748 |
| 2010 | 17,984 | 19,641 | 7,045 |
| 2011 | 18,660 | 20,157 | 6,659 |
| 2012 | 19,802 | 20,712 | 6,741 |
| 2013 | 21,032 | 21,125 | 6,897 |
| 2014 | 21,807 | 20,794 | 6,674 |
| 2015 | 22,491 | 21,384 | 6,712 |
| 2016 | 22,863 | 22,038 | 6,720 |
- SOURCE: Doctorate Recipients from U.S. Universities 2016. Related detailed data: tables 1, 27.