SOURCE: National Center for Science and Engineering Statistics, FFRDC Research and Development Survey.
by Michael T. Gibbons[1]
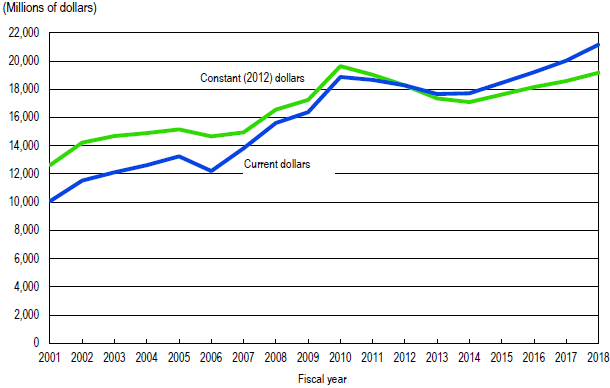
The nation's 42 federally funded research and development centers (FFRDCs) spent more than $21 billion on research and development in FY 2018, an annual increase of 5.7% in current dollars (table 1). The federal government's share of support approached $20.8 billion in FY 2018 and represented a 5.6% increase in federal R&D support to FFRDCs—the fifth consecutive year of nominal growth after funding declines in FYs 2011–13. In constant dollars, total FFRDC R&D expenditures rose 3.1% from FY 2017 to FY 2018 (figure 1). Since FY 2008, total R&D spending at FFRDCs has increased at an average annual rate of 1.5% in constant dollars and 3.1% in current dollars. These and the other statistics in this report come from the FY 2018 FFRDC Research and Development Survey, conducted by the National Center for Science and Engineering Statistics (NCSES) within the National Science Foundation (NSF).
| Fiscal year | All R&D expenditures |
Federal government |
State and local government |
Business | Nonprofit organizations |
All other sources |
|---|---|---|---|---|---|---|
SOURCE: National Center for Science and Engineering Statistics, FFRDC Research and Development Survey. |
||||||
| 2010 | 18,880,609 | 18,453,552 | 52,871 | 168,561 | 23,665 | 181,960 |
| 2011 | 18,671,245 | 18,276,088 | 26,744 | 190,111 | 38,878 | 139,424 |
| 2012 | 18,280,943 | 17,875,012 | 39,428 | 184,434 | 45,926 | 136,143 |
| 2013 | 17,667,184 | 17,284,513 | 50,449 | 186,911 | 39,390 | 105,921 |
| 2014 | 17,718,556 | 17,331,396 | 28,337 | 220,735 | 37,182 | 100,906 |
| 2015 | 18,458,257 | 18,097,189 | 18,427 | 208,780 | 27,984 | 105,877 |
| 2016 | 19,219,702 | 18,855,593 | 21,556 | 192,239 | 40,195 | 110,119 |
| 2017 | 20,038,307 | 19,667,804 | 29,029 | 192,107 | 46,526 | 102,841 |
| 2018 | 21,171,529 | 20,770,388 | 43,458 | 197,975 | 43,630 | 116,078 |
SOURCE: National Center for Science and Engineering Statistics, FFRDC Research and Development Survey.
FFRDCs are privately operated R&D organizations that are exclusively or substantially financed by the federal government. Over 98% ($20.8 billion) of FFRDC R&D expenditures were funded by the federal government in FY 2018 (table 1). The remaining $401.1 million was funded by nonfederal sources, including businesses ($198.0 million), nonprofit organizations ($43.6 million), state and local governments ($43.5 million), and all other sources ($116.1 million), such as funds from foreign governments and foreign or U.S. universities.
Over 95% of the federally funded R&D expenditures at FFRDCs came from seven agencies (table 2). The Department of Energy (DOE) accounted for 50.1% of this federally funded R&D spending. The Department of Defense (DOD) ($4.5 billion) and the National Aeronautics and Space Administration (NASA) ($2.9 billion) were the only other agencies funding greater than $1 billion, although the Department of Health and Human Services, which includes the National Institutes of Health, funded R&D expenditures worth $989.5 million, primarily to support the Frederick National Laboratory for Cancer Research. Around $1 billion of federally funded R&D came from agencies other than the largest seven, or the federal sources were unidentified in the survey for security reasons. Sandia National Laboratories is notable due to the diversity of the large R&D totals funded by several federal agencies, in support of various national security related programs. Sandia conducted close to $2 billion in R&D funded by DOE, $833.2 million funded by DOD, $49.8 million funded by the Department of Homeland Security, and over $100 million funded by other federal agencies.
| FFRDC | All federal R&D expenditures |
DOD | DOE | HHS | DHS | DOT | NASA | NSF | Other |
|---|---|---|---|---|---|---|---|---|---|
DHS = Department of Homeland Security; DOD = Department of Defense; DOE = Department of Energy; DOT = Department of Transportation; FFRDC = federally funded research and development center; HHS = Department of Health and Human Services; NASA = National Aeronautics and Space Administration; NSF = National Science Foundation. SOURCE: National Center for Science and Engineering Statistics, FFRDC Research and Development Survey, FY 2018. |
|||||||||
| All FFRDCs | 20,770,388 | 4,474,684 | 10,398,348 | 989,479 | 542,355 | 175,460 | 2,938,629 | 247,629 | 1,003,804 |
| University-administered FFRDCs | 6,560,094 | 987,981 | 2,281,061 | 33,818 | 104,514 | 8,822 | 2,782,169 | 237,460 | 124,269 |
| Ames Laboratory | 35,696 | 0 | 35,449 | 0 | 0 | 0 | 0 | 0 | 247 |
| Argonne National Laboratory | 747,349 | 19,215 | 667,285 | 4,672 | 28,064 | 3,099 | 479 | 2,586 | 21,949 |
| Fermi National Accelerator Laboratory | 327,630 | 938 | 326,552 | 0 | 64 | 0 | 17 | 59 | 0 |
| Jet Propulsion Laboratory | 2,733,908 | 0 | 0 | 0 | 0 | 0 | 2,733,908 | 0 | 0 |
| Lawrence Berkeley National Laboratory | 769,839 | 11,582 | 723,203 | 24,643 | 3,012 | 0 | 3,833 | 0 | 3,566 |
| Lincoln Laboratory | 1,001,849 | 862,555 | 2,078 | 0 | 30,851 | 0 | 31,887 | 0 | 74,478 |
| National Center for Atmospheric Research | 139,532 | 5,625 | 4,027 | 100 | 0 | 5,346 | 9,361 | 101,293 | 13,780 |
| National Optical Astronomy Observatory | 24,172 | 46 | 2,498 | 0 | 0 | 0 | 328 | 21,300 | 0 |
| National Radio Astronomy Observatory | 98,642 | 529 | 0 | 0 | 0 | 0 | 603 | 97,510 | 0 |
| National Solar Observatory | 14,027 | 0 | 0 | 0 | 0 | 0 | 664 | 13,321 | 42 |
| Princeton Plasma Physics Laboratory | 82,057 | 223 | 81,052 | 0 | 0 | 0 | 752 | 21 | 9 |
| SLAC National Accelerator Laboratory | 326,587 | 1,601 | 319,922 | 3,515 | 0 | 0 | 181 | 1,368 | 0 |
| Software Engineering Institute | 142,877 | 85,624 | 3,155 | 888 | 42,523 | 377 | 112 | 0 | 10,198 |
| Thomas Jefferson National Accelerator Facility | 115,929 | 43 | 115,840 | 0 | 0 | 0 | 44 | 2 | 0 |
| Nonprofit-administered FFRDCs | 6,490,564 | 2,358,905 | 2,698,015 | 197,815 | 287,593 | 164,357 | 97,193 | 10,169 | 676,517 |
| Aerospace Federally Funded Research and Development Center | 1,018,425 | 906,077 | 9,571 | 0 | 5,567 | 659 | 58,514 | 1,474 | 36,563 |
| Arroyo Center | 39,738 | 39,738 | 0 | 0 | 0 | 0 | 0 | 0 | 0 |
| Brookhaven National Laboratory | 525,170 | 138 | 499,070 | 3,865 | 1,294 | 0 | 7,836 | 0 | 12,967 |
| Center for Advanced Aviation System Development | 156,437 | 0 | 0 | 0 | 0 | 156,437 | 0 | 0 | 0 |
| Center for Communications and Computing | 68,237 | 68,237 | 0 | 0 | 0 | 0 | 0 | 0 | 0 |
| Center for Enterprise Modernization | 161,448 | 0 | 0 | 0 | 0 | 0 | 391 | 0 | 161,057 |
| Center for Naval Analyses | 95,198 | 95,198 | 0 | 0 | 0 | 0 | 0 | 0 | 0 |
| Center for Nuclear Waste Regulatory Analyses | 4,647 | 1 | 2 | 0 | 0 | 91 | 0 | 0 | 4,553 |
| CMS Alliance to Modernize Healthcare | 175,030 | 0 | 0 | 175,030 | 0 | 0 | 0 | 0 | 0 |
| Homeland Security Operational Analysis Center | 46,321 | 0 | 0 | 0 | 46,321 | 0 | 0 | 0 | 0 |
| Homeland Security Systems Engineering and Development Institute | 104,689 | 0 | 0 | 0 | 104,689 | 0 | 0 | 0 | 0 |
| Judiciary Engineering and Modernization Center | 6,697 | 0 | 0 | 0 | 0 | 0 | 0 | 0 | 6,697 |
| National Biodefense Analysis and Countermeasures Center | 37,598 | 0 | 0 | 0 | 37,598 | 0 | 0 | 0 | 0 |
| National Cybersecurity Center of Excellence | 19,556 | 0 | 0 | 0 | 0 | 0 | 0 | 0 | 19,556 |
| National Defense Research Institute | 57,743 | 56,349 | 0 | 0 | 563 | 0 | 0 | 0 | 831 |
| National Renewable Energy Laboratory | 349,410 | 8,636 | 324,591 | 0 | 185 | 969 | 177 | 0 | 14,852 |
| National Security Engineering Center | 1,077,697 | 862,330 | 293 | 0 | 49 | 0 | 108 | 0 | 214,917 |
| Oak Ridge National Laboratory | 1,378,398 | 27,034 | 1,179,439 | 6,257 | 16,330 | 6,117 | 28,733 | 0 | 114,488 |
| Pacific Northwest National Laboratory | 943,147 | 78,275 | 685,049 | 12,663 | 74,997 | 84 | 1,434 | 609 | 90,036 |
| Project Air Force | 48,858 | 48,858 | 0 | 0 | 0 | 0 | 0 | 0 | 0 |
| Science and Technology Policy Institute | 8,086 | 0 | 0 | 0 | 0 | 0 | 0 | 8,086 | 0 |
| Systems and Analyses Center | 168,034 | 168,034 | 0 | 0 | 0 | 0 | 0 | 0 | 0 |
| Industry-administered FFRDCs | 7,719,730 | 1,127,798 | 5,419,272 | 757,846 | 150,248 | 2,281 | 59,267 | 0 | 203,018 |
| Frederick National Laboratory for Cancer Research | 748,500 | 1,208 | 0 | 747,291 | 0 | 0 | 0 | 0 | 1 |
| Idaho National Laboratory | 376,053 | 47,526 | 260,233 | 1 | 47,621 | 0 | 583 | 0 | 20,089 |
| Lawrence Livermore National Laboratory | 1,353,502 | 190,789 | 1,118,727 | 3,507 | 32,185 | 0 | 1,819 | 0 | 6,475 |
| Los Alamos National Laboratory | 2,120,857 | 40,950 | 1,933,691 | 6,393 | 14,466 | 0 | 53,975 | 0 | 71,382 |
| Sandia National Laboratories | 2,967,822 | 833,246 | 1,974,503 | 654 | 49,769 | 2,281 | 2,890 | 0 | 104,479 |
| Savannah River National Laboratory | 152,996 | 14,079 | 132,118 | 0 | 6,207 | 0 | 0 | 0 | 592 |
The majority of FFRDCs (31 centers) increased R&D spending in FY 2018, with 17 centers reporting an increase greater than the overall average of 5.7% (table 3). Eight FFRDCs reported more than $1 billion each (a combined $13.8 billion) in R&D expenditures for FY 2018—the NASA-sponsored Jet Propulsion Laboratory; four DOE-sponsored National Laboratories specializing in energy and the environment, national security, and nuclear science: Lawrence Livermore, Los Alamos, Oak Ridge, and Sandia; the DOD-sponsored National Security Engineering Center; Lincoln Laboratory (jointly sponsored by the DOD and the Office of the Secretary of Defense); and the Aerospace FFRDC, which is jointly sponsored by DOD and the Air Force. Sandia National Laboratories was the largest performer with $3 billion in total R&D. The Jet Propulsion Laboratory reported the largest dollar increase in R&D of any center, increasing by $409 million in FY 2018, following a $472.5 million increase in FY 2017. Eleven FFRDCs reported lower expenditures in FY 2018, although two of those declined by less than 1%. Of the 41 FFRDCs listed continuously since 2015, 33 centers reported greater expenditures in FY 2018 compared to FY 2015.
| FFRDC | 2015 | 2016 | 2017 | 2018 | % change 2017–18 |
|---|---|---|---|---|---|
na = not applicable. FFRDC = federally funded research and development center. SOURCE: National Center for Science and Engineering Statistics, FFRDC Research and Development Survey. |
|||||
| All FFRDCs | 18,458,257 | 19,219,702 | 20,038,307 | 21,171,529 | 5.7 |
| University-administered FFRDCs | 5,483,466 | 5,669,908 | 6,155,252 | 6,715,338 | 9.1 |
| Ames Laboratory | 45,845 | 46,886 | 53,527 | 36,858 | -31.1 |
| Argonne National Laboratory | 719,521 | 733,377 | 723,824 | 777,246 | 7.4 |
| Fermi National Accelerator Laboratory | 319,700 | 323,507 | 320,516 | 328,419 | 2.5 |
| Jet Propulsion Laboratory | 1,749,689 | 1,852,369 | 2,324,826 | 2,733,908 | 17.6 |
| Lawrence Berkeley National Laboratory | 792,457 | 797,831 | 813,267 | 832,457 | 2.4 |
| Lincoln Laboratory | 914,071 | 949,138 | 969,090 | 1,013,320 | 4.6 |
| National Center for Atmospheric Research | 166,385 | 177,422 | 171,551 | 158,260 | -7.7 |
| National Optical Astronomy Observatory | 23,660 | 24,917 | 25,906 | 33,874 | 30.8 |
| National Radio Astronomy Observatory | 89,689 | 90,411 | 91,720 | 100,691 | 9.8 |
| National Solar Observatory | 11,752 | 12,783 | 11,841 | 14,733 | 24.4 |
| Princeton Plasma Physics Laboratory | 81,348 | 82,246 | 81,444 | 82,435 | 1.2 |
| SLAC National Accelerator Laboratory | 310,167 | 313,031 | 327,453 | 341,615 | 4.3 |
| Software Engineering Institute | 131,146 | 145,981 | 132,967 | 142,891 | 7.5 |
| Thomas Jefferson National Accelerator Facility | 128,036 | 120,009 | 107,320 | 118,631 | 10.5 |
| Nonprofit-administered FFRDCs | 6,121,483 | 6,128,058 | 6,413,612 | 6,617,274 | 3.2 |
| Aerospace Federally Funded Research and Development Center | 888,119 | 909,868 | 942,704 | 1,020,827 | 8.3 |
| Arroyo Center | 40,594 | 44,616 | 42,723 | 39,738 | -7.0 |
| Brookhaven National Laboratory | 587,194 | 579,087 | 556,875 | 552,640 | -0.8 |
| Center for Advanced Aviation System Development | 155,696 | 156,644 | 168,169 | 177,530 | 5.6 |
| Center for Communications and Computing | 56,478 | 61,625 | 66,692 | 68,237 | 2.3 |
| Center for Enterprise Modernization | 145,442 | 146,436 | 154,933 | 162,690 | 5.0 |
| Center for Naval Analyses | 80,358 | 84,232 | 90,401 | 95,198 | 5.3 |
| Center for Nuclear Waste Regulatory Analyses | 12,636 | 8,600 | 6,312 | 5,054 | -19.9 |
| CMS Alliance to Modernize Healthcare | 168,142 | 141,860 | 169,013 | 175,030 | 3.6 |
| Homeland Security Operational Analysis Center | na | na | 8,622 | 46,321 | 437.2 |
| Homeland Security Studies and Analysis Institute | 16,965 | 22,038 | na | na | na |
| Homeland Security Systems Engineering and Development Institute | 77,176 | 101,628 | 104,414 | 104,689 | 0.3 |
| Judiciary Engineering and Modernization Center | 4,318 | 9,289 | 8,030 | 6,697 | -16.6 |
| National Biodefense Analysis and Countermeasures Center | 30,716 | 32,902 | 34,991 | 37,598 | 7.5 |
| National Cybersecurity Center of Excellence | 7,843 | 13,076 | 13,436 | 19,556 | 45.5 |
| National Defense Research Institute | 56,736 | 62,848 | 69,013 | 57,743 | -16.3 |
| National Renewable Energy Laboratory | 378,436 | 362,087 | 357,916 | 388,500 | 8.5 |
| National Security Engineering Center | 919,441 | 966,542 | 1,012,155 | 1,078,610 | 6.6 |
| Oak Ridge National Laboratory | 1,333,332 | 1,283,729 | 1,403,204 | 1,399,445 | -0.3 |
| Pacific Northwest National Laboratory | 951,099 | 914,747 | 983,962 | 956,193 | -2.8 |
| Project Air Force | 44,393 | 49,165 | 48,521 | 48,858 | 0.7 |
| Science and Technology Policy Institute | 8,724 | 7,459 | 8,401 | 8,086 | -3.7 |
| Systems and Analyses Center | 157,645 | 169,580 | 163,125 | 168,034 | 3.0 |
| Industry-administered FFRDCs | 6,853,308 | 7,421,736 | 7,469,443 | 7,838,917 | 4.9 |
| Frederick National Laboratory for Cancer Research | 495,300 | 642,165 | 704,223 | 748,500 | 6.3 |
| Idaho National Laboratory | 476,376 | 521,618 | 482,840 | 395,112 | -18.2 |
| Lawrence Livermore National Laboratory | 1,273,066 | 1,363,525 | 1,290,134 | 1,386,687 | 7.5 |
| Los Alamos National Laboratory | 1,865,000 | 1,987,000 | 1,972,769 | 2,145,232 | 8.7 |
| Sandia National Laboratories | 2,621,891 | 2,781,547 | 2,878,000 | 3,009,105 | 4.6 |
| Savannah River National Laboratory | 121,675 | 125,881 | 141,477 | 154,281 | 9.1 |
The statistics on FFRDC R&D expenditures presented in this report come from the FY 2018 FFRDC Research and Development Survey. This annual survey is completed by FFRDC administrators and collects data from FFRDCs on R&D expenditures by source of funds (federal government, state and local governments, businesses, nonprofit organizations, or other), type of R&D (basic research, applied research, or experimental development), and type of cost (salaries, software, equipment, subcontracts, or indirect costs). This survey has been a census of the full population of FFRDCs since FY 2001. For a list of criteria used to define the set of FFRDCs, see the general guidelines of the Master Government List of FFRDCs at https://www.nsf.gov/statistics/ffrdclist/#guide&gennotes.
The full set of data tables from this survey and more information on the survey methodology are available at https://ncsesdata.nsf.gov/datatables/ffrdcrd/2018/.
[1] Michael T. Gibbons, Research and Development Statistics Program, National Center for Science and Engineering Statistics, National Science Foundation, 2415 Eisenhower Avenue, Suite W14200, Alexandria, VA 22314 (mgibbons@nsf.gov; 703-292-4590)