SOURCE: National Center for Science and Engineering Statistics, Survey of Graduate Students and Postdoctorates in Science and Engineering, 2018.
by Michael Yamaner and Caren A. Arbeit[1]
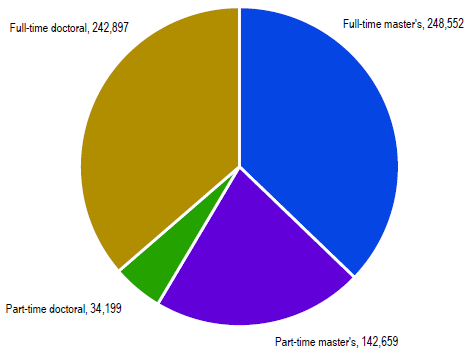
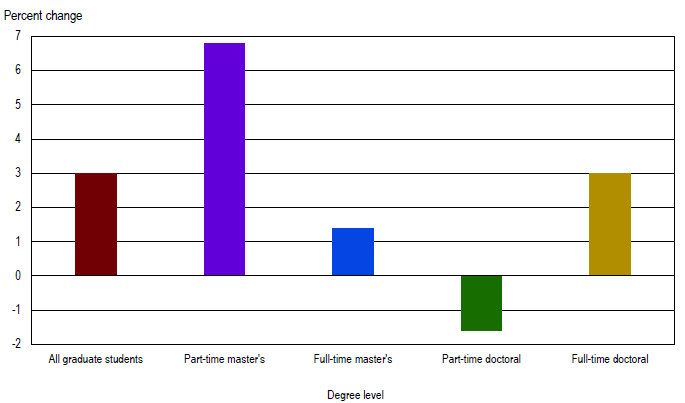
The number of graduate students enrolled in science, engineering, and health (SEH) programs at U.S. academic institutions rose by 3% between 2017 and 2018, growing to 668,307. Of the 2018 students, 36% were in full-time doctoral programs and 37% were in full-time master's programs (figure 1). The increase in overall enrollment was driven by increases in part-time master's, full-time doctoral, and full-time master's students (increases of 9,082, 7,119, and 3,542 students, respectively). Part-time doctoral enrollment declined by 548 students (figure 2, table 1, and table 2).
These and other findings are from the 2018 Survey of Graduate Students and Postdoctorates in Science and Engineering (GSS). Data from the GSS provide insight into the composition of the current and future science and engineering (S&E) workforce by collecting data on doctorate-holding nonfaculty researchers (NFRs), postdoctoral appointees (postdocs), and graduate students in SEH fields. Beginning in 2017, the GSS started collecting information on master's and doctoral students separately in order to look at differences in enrollment patterns and financial support. This 2018 report is the first to show trend data by graduate degree type. The GSS is sponsored by the National Center for Science and Engineering Statistics (NCSES) within the National Science Foundation (NSF) and by the National Institutes of Health (NIH).
SOURCE: National Center for Science and Engineering Statistics, Survey of Graduate Students and Postdoctorates in Science and Engineering, 2018.
SOURCE: National Center for Science and Engineering Statistics, Survey of Graduate Students and Postdoctorates in Science and Engineering.
| Characteristic | All | Full time | Part time | Percent change | |||||||||
|---|---|---|---|---|---|---|---|---|---|---|---|---|---|
| 2017 | 2018 | 2017 | 2018 | 2017 | 2018 | All | Full time | Part time | |||||
a Race and ethnicity data are available for U.S. citizens and permanent residents only. SOURCE: National Center for Science and Engineering Statistics, Survey of Graduate Students and Postdoctorates in Science and Engineering. |
|||||||||||||
| All surveyed fields | 270,525 | 277,096 | 235,778 | 242,897 | 34,747 | 34,199 | 2.4 | 3.0 | -1.6 | ||||
| Male | 155,699 | 158,019 | 136,596 | 139,257 | 19,103 | 18,762 | 1.5 | 1.9 | -1.8 | ||||
| Female | 114,826 | 119,077 | 99,182 | 103,640 | 15,644 | 15,437 | 3.7 | 4.5 | -1.3 | ||||
| U.S. citizens and permanent residentsa | 164,585 | 167,291 | 139,077 | 142,158 | 25,508 | 25,133 | 1.6 | 2.2 | -1.5 | ||||
| Male | 86,517 | 86,601 | 73,517 | 73,849 | 13,000 | 12,752 | 0.1 | 0.5 | -1.9 | ||||
| Female | 78,068 | 80,690 | 65,560 | 68,309 | 12,508 | 12,381 | 3.4 | 4.2 | -1.0 | ||||
| Hispanic or Latino | 14,999 | 16,161 | 12,935 | 14,009 | 2,064 | 2,152 | 7.7 | 8.3 | 4.3 | ||||
| Not Hispanic or Latino | |||||||||||||
| American Indian or Alaska Native | 714 | 713 | 546 | 580 | 168 | 133 | -0.1 | 6.2 | -20.8 | ||||
| Asian | 15,952 | 16,750 | 13,992 | 14,789 | 1,960 | 1,961 | 5.0 | 5.7 | 0.1 | ||||
| Black or African American | 9,483 | 10,065 | 7,343 | 7,866 | 2,140 | 2,199 | 6.1 | 7.1 | 2.8 | ||||
| Native Hawaiian or Other Pacific Islander | 235 | 233 | 190 | 189 | 45 | 44 | -0.9 | -0.5 | -2.2 | ||||
| White | 109,271 | 109,725 | 92,215 | 93,243 | 17,056 | 16,482 | 0.4 | 1.1 | -3.4 | ||||
| More than one race | 5,420 | 5,744 | 4,816 | 5,047 | 604 | 697 | 6.0 | 4.8 | 15.4 | ||||
| Unknown race and ethnicity | 8,511 | 7,900 | 7,040 | 6,435 | 1,471 | 1,465 | -7.2 | -8.6 | -0.4 | ||||
| Temporary visa holders | 105,940 | 109,805 | 96,701 | 100,739 | 9,239 | 9,066 | 3.6 | 4.2 | -1.9 | ||||
| Male | 69,182 | 71,418 | 63,079 | 65,408 | 6,103 | 6,010 | 3.2 | 3.7 | -1.5 | ||||
| Female | 36,758 | 38,387 | 33,622 | 35,331 | 3,136 | 3,056 | 4.4 | 5.1 | -2.6 | ||||
| Science and engineering | 255,224 | 261,165 | 224,695 | 231,297 | 30,529 | 29,868 | 2.3 | 2.9 | -2.2 | ||||
| Science | 186,399 | 190,928 | 165,120 | 170,004 | 21,279 | 20,924 | 2.4 | 3.0 | -1.7 | ||||
| Agricultural sciences | 3,744 | 3,880 | 3,157 | 3,273 | 587 | 607 | 3.6 | 3.7 | 3.4 | ||||
| Biological and biomedical sciences | 51,291 | 52,627 | 47,977 | 49,254 | 3,314 | 3,373 | 2.6 | 2.7 | 1.8 | ||||
| Computer and information sciences | 14,291 | 16,127 | 11,886 | 13,596 | 2,405 | 2,531 | 12.8 | 14.4 | 5.2 | ||||
| Geosciences, atmospheric sciences, and ocean sciences | 6,539 | 6,704 | 5,797 | 5,950 | 742 | 754 | 2.5 | 2.6 | 1.6 | ||||
| Mathematics and statistics | 13,101 | 13,388 | 11,903 | 12,248 | 1,198 | 1,140 | 2.2 | 2.9 | -4.8 | ||||
| Multidisciplinary and interdisciplinary studies | 2,931 | 2,924 | 2,320 | 2,388 | 611 | 536 | -0.2 | 2.9 | -12.3 | ||||
| Natural resources and conservation | 3,568 | 3,716 | 2,831 | 2,962 | 737 | 754 | 4.1 | 4.6 | 2.3 | ||||
| Physical sciences | 35,461 | 36,000 | 32,954 | 33,756 | 2,507 | 2,244 | 1.5 | 2.4 | -10.5 | ||||
| Psychology | 20,395 | 20,303 | 16,617 | 16,538 | 3,778 | 3,765 | -0.5 | -0.5 | -0.3 | ||||
| Social sciences | 35,078 | 35,259 | 29,678 | 30,039 | 5,400 | 5,220 | 0.5 | 1.2 | -3.3 | ||||
| Engineering | 68,825 | 70,237 | 59,575 | 61,293 | 9,250 | 8,944 | 2.1 | 2.9 | -3.3 | ||||
| Aerospace, aeronautical, and astronautical engineering | 2,386 | 2,506 | 2,078 | 2,173 | 308 | 333 | 5.0 | 4.6 | 8.1 | ||||
| Bioengineering and biomedical engineering | 6,845 | 7,278 | 6,103 | 6,564 | 742 | 714 | 6.3 | 7.6 | -3.8 | ||||
| Chemical engineering | 6,874 | 6,950 | 6,451 | 6,583 | 423 | 367 | 1.1 | 2.0 | -13.2 | ||||
| Civil engineering | 7,626 | 7,732 | 6,529 | 6,573 | 1,097 | 1,159 | 1.4 | 0.7 | 5.7 | ||||
| Electrical, electronics, and communications engineering | 17,936 | 18,119 | 15,263 | 15,473 | 2,673 | 2,646 | 1.0 | 1.4 | -1.0 | ||||
| Engineering mechanics, physics, and science | 1,457 | 1,428 | 1,333 | 1,296 | 124 | 132 | -2.0 | -2.8 | 6.5 | ||||
| Industrial and manufacturing engineering | 3,633 | 3,598 | 2,841 | 2,901 | 792 | 697 | -1.0 | 2.1 | -12.0 | ||||
| Mechanical engineering | 11,149 | 11,159 | 9,744 | 9,898 | 1,405 | 1,261 | 0.1 | 1.6 | -10.2 | ||||
| Metallurgical and materials engineering | 4,426 | 4,610 | 4,071 | 4,284 | 355 | 326 | 4.2 | 5.2 | -8.2 | ||||
| Other engineeringb | 6,493 | 6,857 | 5,162 | 5,548 | 1,331 | 1,309 | 5.6 | 7.5 | -1.7 | ||||
| Health | 15,301 | 15,931 | 11,083 | 11,600 | 4,218 | 4,331 | 4.1 | 4.7 | 2.7 | ||||
| Clinical medicine | 4,410 | 4,508 | 3,260 | 3,423 | 1,150 | 1,085 | 2.2 | 5.0 | -5.7 | ||||
| Other health | 10,891 | 11,423 | 7,823 | 8,177 | 3,068 | 3,246 | 4.9 | 4.5 | 5.8 | ||||
| Characteristic | All | Full time | Part time | Percent change | |||||||||
|---|---|---|---|---|---|---|---|---|---|---|---|---|---|
| 2017 | 2018 | 2017 | 2018 | 2017 | 2018 | All | Full time | Part time | |||||
a Race and ethnicity data are available for U.S. citizens and permanent residents only. SOURCE: National Center for Science and Engineering Statistics, Survey of Graduate Students and Postdoctorates in Science and Engineering. |
|||||||||||||
| All surveyed fields | 378,587 | 391,211 | 245,010 | 248,552 | 133,577 | 142,659 | 3.3 | 1.4 | 6.8 | ||||
| Male | 200,748 | 201,314 | 125,897 | 123,457 | 74,851 | 77,857 | 0.3 | -1.9 | 4.0 | ||||
| Female | 177,839 | 189,897 | 119,113 | 125,095 | 58,726 | 64,802 | 6.8 | 5.0 | 10.3 | ||||
| U.S. citizens and permanent residentsa | 251,896 | 271,290 | 141,321 | 149,533 | 110,575 | 121,757 | 7.7 | 5.8 | 10.1 | ||||
| Male | 119,906 | 126,552 | 60,203 | 62,052 | 59,703 | 64,500 | 5.5 | 3.1 | 8.0 | ||||
| Female | 131,990 | 144,738 | 81,118 | 87,481 | 50,872 | 57,257 | 9.7 | 7.8 | 12.6 | ||||
| Hispanic or Latino | 29,622 | 32,923 | 17,316 | 19,011 | 12,306 | 13,912 | 11.1 | 9.8 | 13.1 | ||||
| Not Hispanic or Latino | |||||||||||||
| American Indian or Alaska Native | 1,136 | 1,219 | 706 | 685 | 430 | 534 | 7.3 | -3.0 | 24.2 | ||||
| Asian | 26,093 | 28,557 | 14,825 | 15,882 | 11,268 | 12,675 | 9.4 | 7.1 | 12.5 | ||||
| Black or African American | 23,266 | 25,878 | 11,846 | 13,294 | 11,420 | 12,584 | 11.2 | 12.2 | 10.2 | ||||
| Native Hawaiian or Other Pacific Islander | 468 | 497 | 240 | 269 | 228 | 228 | 6.2 | 12.1 | 0.0 | ||||
| White | 148,031 | 156,010 | 83,943 | 86,699 | 64,088 | 69,311 | 5.4 | 3.3 | 8.1 | ||||
| More than one race | 8,119 | 9,120 | 4,996 | 5,455 | 3,123 | 3,665 | 12.3 | 9.2 | 17.4 | ||||
| Unknown race and ethnicity | 15,161 | 17,086 | 7,449 | 8,238 | 7,712 | 8,848 | 12.7 | 10.6 | 14.7 | ||||
| Temporary visa holders | 126,691 | 119,921 | 103,689 | 99,019 | 23,002 | 20,902 | -5.3 | -4.5 | -9.1 | ||||
| Male | 80,842 | 74,762 | 65,694 | 61,405 | 15,148 | 13,357 | -7.5 | -6.5 | -11.8 | ||||
| Female | 45,849 | 45,159 | 37,995 | 37,614 | 7,854 | 7,545 | -1.5 | -1.0 | -3.9 | ||||
| Science and engineering | 325,925 | 334,391 | 209,221 | 210,287 | 116,704 | 124,104 | 2.6 | 0.5 | 6.3 | ||||
| Science | 229,169 | 241,327 | 145,689 | 151,059 | 83,480 | 90,268 | 5.3 | 3.7 | 8.1 | ||||
| Agricultural sciences | 5,603 | 5,658 | 3,609 | 3,626 | 1,994 | 2,032 | 1.0 | 0.5 | 1.9 | ||||
| Biological and biomedical sciences | 33,926 | 35,306 | 23,889 | 24,759 | 10,037 | 10,547 | 4.1 | 3.6 | 5.1 | ||||
| Computer and information sciences | 75,618 | 77,351 | 44,320 | 44,193 | 31,298 | 33,158 | 2.3 | -0.3 | 5.9 | ||||
| Geosciences, atmospheric sciences, and ocean sciences | 6,006 | 5,629 | 4,107 | 3,820 | 1,899 | 1,809 | -6.3 | -7.0 | -4.7 | ||||
| Mathematics and statistics | 16,568 | 18,073 | 11,551 | 12,707 | 5,017 | 5,366 | 9.1 | 10.0 | 7.0 | ||||
| Multidisciplinary and interdisciplinary studies | 6,923 | 7,414 | 4,038 | 4,268 | 2,885 | 3,146 | 7.1 | 5.7 | 9.0 | ||||
| Natural resources and conservation | 7,311 | 7,691 | 4,866 | 5,072 | 2,445 | 2,619 | 5.2 | 4.2 | 7.1 | ||||
| Physical sciences | 6,368 | 6,075 | 4,197 | 3,915 | 2,171 | 2,160 | -4.6 | -6.7 | -0.5 | ||||
| Psychology | 29,638 | 35,404 | 19,318 | 21,987 | 10,320 | 13,417 | 19.5 | 13.8 | 30.0 | ||||
| Social sciences | 41,208 | 42,726 | 25,794 | 26,712 | 15,414 | 16,014 | 3.7 | 3.6 | 3.9 | ||||
| Engineering | 96,756 | 93,064 | 63,532 | 59,228 | 33,224 | 33,836 | -3.8 | -6.8 | 1.8 | ||||
| Aerospace, aeronautical, and astronautical engineering | 3,322 | 3,342 | 2,183 | 2,128 | 1,139 | 1,214 | 0.6 | -2.5 | 6.6 | ||||
| Bioengineering and biomedical engineering | 4,037 | 4,202 | 3,234 | 3,369 | 803 | 833 | 4.1 | 4.2 | 3.7 | ||||
| Chemical engineering | 3,292 | 3,061 | 2,396 | 2,220 | 896 | 841 | -7.0 | -7.3 | -6.1 | ||||
| Civil engineering | 13,506 | 12,729 | 9,084 | 8,289 | 4,422 | 4,440 | -5.8 | -8.8 | 0.4 | ||||
| Electrical, electronics, and communications engineering | 29,816 | 28,108 | 20,941 | 19,341 | 8,875 | 8,767 | -5.7 | -7.6 | -1.2 | ||||
| Engineering mechanics, physics, and science | 679 | 729 | 428 | 472 | 251 | 257 | 7.4 | 10.3 | 2.4 | ||||
| Industrial and manufacturing engineering | 12,272 | 12,389 | 7,212 | 6,492 | 5,060 | 5,897 | 1.0 | -10.0 | 16.5 | ||||
| Mechanical engineering | 16,279 | 15,434 | 10,778 | 10,178 | 5,501 | 5,256 | -5.2 | -5.6 | -4.5 | ||||
| Metallurgical and materials engineering | 2,115 | 2,079 | 1,587 | 1,539 | 528 | 540 | -1.7 | -3.0 | 2.3 | ||||
| Other engineeringb | 11,438 | 10,991 | 5,689 | 5,200 | 5,749 | 5,791 | -3.9 | -8.6 | 0.7 | ||||
| Health | 52,662 | 56,820 | 35,789 | 38,265 | 16,873 | 18,555 | 7.9 | 6.9 | 10.0 | ||||
| Clinical medicine | 25,283 | 27,494 | 15,043 | 16,233 | 10,240 | 11,261 | 8.7 | 7.9 | 10.0 | ||||
| Other health | 27,379 | 29,326 | 20,746 | 22,032 | 6,633 | 7,294 | 7.1 | 6.2 | 10.0 | ||||
Counts of doctoral students receiving training in SEH are a key indicator of the vitality of the research and development enterprise in the United States. Between 2017 and 2018, doctoral program enrollment increased by 6,571 students, or 2%. This includes a 3% increase in the number of full-time doctoral students but also a 2% decline in part-time doctoral students (table 1).
Data on the doctoral enrollment population provide information on the demographic composition of the students, their fields of study, and changes over time. Between 2017 and 2018, doctoral enrollment increased by 2,706 students (2%) among U.S. citizens and permanent residents and increased by 3,865 students (4%) among temporary visa holders. In 2018, 88% of doctoral students were enrolled full-time (table 1).
Doctoral enrollment for several historically underrepresented groups also grew between 2017 and 2018. Specifically, doctoral enrollment among women grew at more than twice the rate of male enrollment (4% vs. 2%). Also, doctoral enrollment among Hispanics or Latinos and among blacks or African Americans grew by 8% and 6%, respectively, compared to an increase of less than 1% among whites (table 1).
Across the SEH fields of study, full-time doctoral enrollment rose in 20 of the 22 fields of study between 2017 and 2018. Computer and information sciences had the largest increase in full-time students, rising by 1,710 students (14%), while the field of psychology and the field of engineering mechanics, physics, and science saw the only declines in full-time enrollment, falling by 79 students (-1%) and 37 students (-3%), respectively. Part-time doctoral enrollment fell in 13 of the 22 fields. Physical sciences saw the largest decline in part-time doctoral students, falling by 263 (-11%), and other health saw the largest increase, rising by 178 part-time students (6%) (table 1).
Master's degree holders are an essential part of the highly skilled S&E workforce, with nearly one-quarter of non-academic S&E workers holding a master's degree (24%)[2]. Between 2017 and 2018, enrollment in master's degree programs grew by 12,624 students (3%). This includes a rise in both full- and part-time enrollment, which increased by 3,542 students (1%) and 9,082 students (7%), respectively. In 2018, 64% of master's students were enrolled full time (table 2).
Between 2017 and 2018, enrollment in SEH master's programs among U.S. citizens and permanent residents increased by 19,394 students (8%), which included an increase of 8,212 enrolled full time (6%) and an increase of 11,182 enrolled part time (10%). Overall, there was a 5% decline in temporary visa holders (6,770 students) enrolled in master's-level SEH programs (table 2).
Overall, enrollment in master's programs increased by 12,058 women (7%) and by 566 men (less than 1%) between 2017 and 2018. Among U.S. citizens and permanent residents, enrollment among women rose by 12,748 (10%), of which 6,363 were enrolled full time (8% increase) and 6,385 were enrolled part time (13% increase). Among temporary visa holders, enrollment declined by 6,080 men (-8%) and 690 women (-2%) (table 2).
Between 2017 and 2018, enrollment in master's programs grew at a larger rate for part-time students than for full-time students for all racial and ethnic groups except black or African American students and Native Hawaiian or Pacific Islander students. Enrollment in part-time master's program increased by 10% or more for the following racial and ethnic categories: American Indians or Alaska Natives, Asians, Hispanics or Latinos, blacks or African Americans, and more than one race. The racial and ethnic groups with the largest percent change in total master's enrollment were more than one race and blacks or African Americans, which grew by 12% and 11%, respectively. The percent change for whites was 5% (table 2).
An examination of enrollment by field of study shows that 8 out of 22 fields, including 6 engineering fields, had overall declines in master's enrollment. Electrical, electronics, and communications engineering showed the largest decline in the number of students (-1,708 students), and mechanical engineering had the second largest decline (-845 students). The fields of study with the largest increase in the number of master's students enrolled were psychology and clinical medicine, which rose by 5,766 and 2,211 students, respectively. Both of these fields of study also had large percentage increases in part-time enrollment, rising by 30% and 10%, respectively (table 2).
Postdocs are recent doctorate or doctorate-equivalent recipients pursuing additional training to prepare for an independent career in research. The GSS is the primary source of data on postdoc employment and funding in the United States. The number of postdocs in SEH fields of study rose slightly from 64,733 in 2017 to 64,783 in 2018. However, despite the minimal change in the total number of postdocs, there were noticeable changes in the postdoc distribution by field of research. Geosciences, atmospheric sciences, and ocean sciences saw the largest decrease in the number of postdocs (decline of 363 students, or -17%), while clinical medicine saw the largest increase in number of postdocs (rising by 463 students, or 3%). Biological and biomedical sciences remains the largest SEH field of research accounting for one-third of all postdocs (table 3).
| Sex and field | Postdoctoral appointees | Nonfaculty researchers | ||||||||
|---|---|---|---|---|---|---|---|---|---|---|
| 2017 | 2018 | Change | Percent change |
2017 | 2018 | Change | Percent change |
|||
a Includes Aerospace, aeronautical, and astronautical engineering; Agricultural engineering; Biological and biosystems engineering; Mining engineering; Nanotechnology; Nuclear engineering; Petroleum engineering; and Engineering not elsewhere classified. NOTE: "Field" refers to the field of the unit that reports postdoctoral appointees and nonfaculty researchers. SOURCE: National Center for Science and Engineering Statistics, Survey of Graduate Students and Postdoctorates in Science and Engineering. |
||||||||||
| All surveyed fields | 64,733 | 64,783 | 50 | 0.1 | 28,180 | 29,284 | 1,104 | 3.9 | ||
| Male | 38,870 | 38,661 | -209 | -0.5 | 16,580 | 17,468 | 888 | 5.4 | ||
| Female | 25,863 | 26,122 | 259 | 1.0 | 11,600 | 11,816 | 216 | 1.9 | ||
| Science and engineering | 46,080 | 45,478 | -602 | -1.3 | 20,542 | 21,848 | 1,306 | 6.4 | ||
| Science | 38,241 | 37,564 | -677 | -1.8 | 17,268 | 18,278 | 1,010 | 5.8 | ||
| Agricultural sciences | 1,024 | 1,072 | 48 | 4.7 | 496 | 565 | 69 | 13.9 | ||
| Biological and biomedical sciences | 21,781 | 21,533 | -248 | -1.1 | 8,203 | 8,250 | 47 | 0.6 | ||
| Computer and information sciences | 854 | 879 | 25 | 2.9 | 476 | 515 | 39 | 8.2 | ||
| Geosciences, atmospheric sciences, and ocean sciences | 2,089 | 1,726 | -363 | -17.4 | 1,794 | 2,106 | 312 | 17.4 | ||
| Mathematics and statistics | 991 | 982 | -9 | -0.9 | 240 | 266 | 26 | 10.8 | ||
| Multidisciplinary and interdisciplinary studies | 1,131 | 980 | -151 | -13.4 | 806 | 832 | 26 | 3.2 | ||
| Natural resources and conservation | 731 | 764 | 33 | 4.5 | 364 | 580 | 216 | 59.3 | ||
| Physical sciences | 7,211 | 6,976 | -235 | -3.3 | 2,871 | 3,056 | 185 | 6.4 | ||
| Psychology | 1,082 | 1,145 | 63 | 5.8 | 494 | 507 | 13 | 2.6 | ||
| Social sciences | 1,347 | 1,507 | 160 | 11.9 | 1,524 | 1,601 | 77 | 5.1 | ||
| Engineering | 7,839 | 7,914 | 75 | 1.0 | 3,274 | 3,570 | 296 | 9.0 | ||
| Bioengineering and biomedical engineering | 1,398 | 1,433 | 35 | 2.5 | 415 | 440 | 25 | 6.0 | ||
| Chemical engineering | 1,197 | 1,142 | -55 | -4.6 | 281 | 257 | -24 | -8.5 | ||
| Civil engineering | 804 | 739 | -65 | -8.1 | 422 | 414 | -8 | -1.9 | ||
| Electrical, electronics, and communications engineering | 1,170 | 1,197 | 27 | 2.3 | 557 | 588 | 31 | 5.6 | ||
| Engineering mechanics, physics, and science | 316 | 354 | 38 | 12.0 | 200 | 220 | 20 | 10.0 | ||
| Industrial and manufacturing engineering | 127 | 156 | 29 | 22.8 | 119 | 105 | -14 | -11.8 | ||
| Mechanical engineering | 1,089 | 1,069 | -20 | -1.8 | 458 | 489 | 31 | 6.8 | ||
| Metallurgical and materials engineering | 550 | 549 | -1 | -0.2 | 181 | 215 | 34 | 18.8 | ||
| Other engineering a | 1,188 | 1,275 | 87 | 7.3 | 641 | 842 | 201 | 31.4 | ||
| Health | 18,653 | 19,305 | 652 | 3.5 | 7,638 | 7,436 | -202 | -2.6 | ||
| Clinical medicine | 16,100 | 16,563 | 463 | 2.9 | 6,448 | 6,159 | -289 | -4.5 | ||
| Other health | 2,553 | 2,742 | 189 | 7.4 | 1,190 | 1,277 | 87 | 7.3 | ||
Another important component of the academic research and development workforce are nonfaculty researchers (NFRs) who have doctorate degrees. As with postdocs, the GSS is the primary source of data on this population. As schools improve their administrative data systems to accurately reflect all faculty, the number of NFRs continues to increase. In 2018, 1,104 more NFRs were working at U.S. academic institutions than there were in 2017. Most of these 1,104 NFRs were in science fields of research. Between 2017 and 2018, there was a small decrease of 289 NFRs in clinical medicine (5%), which is the second largest field of study for NFRs behind biological and biomedical sciences (table 3).
Conducted since 1966, the GSS is an annual survey of all academic institutions in the United States that grant research-based master's or doctoral degrees in SEH fields. The 2018 GSS collected data from 19,592 organizational units (departments, programs, affiliated research centers, and health care facilities) at 715 eligible institutions and their affiliates in the United States, Puerto Rico, and Guam. The unit response rate was 98.9%, which is an improvement over 2017's rate of 97.6%. An overview of the survey is available at https://www.nsf.gov/statistics/srvygradpostdoc/.
In 2017, the GSS was redesigned to collect demographic and financial support data separately for master's and doctoral students, to prioritize electronic data interchange as the primary means of data submission[3], and to utilize the U.S. Department of Education's Classification of Instructional Programs (CIP) codes to report fields of study for graduate student enrollment data[4]. More information regarding the 2017 GSS redesign is available in the technical notes for the 2018 data tables (https://ncsesdata.nsf.gov/gradpostdoc/2018/gss18-tech-notes.pdf). Further, in 2017, NSF updated the GSS fields of study to align with the NCSES Taxonomy of Disciplines to increase comparability to other NCSES surveys and more accurately reflect how disciplines are currently organized.
Due to these changes, the 2017 and 2018 data are not directly comparable to previously collected GSS data. Trend comparisons can be made using the "2017old" estimates in the 2017 data tables, available at https://ncsesdata.nsf.gov/gradpostdoc/2017/.
GSS health fields are collected under the advisement of NIH. These GSS fields are about one-third of all health fields in the U.S. Department of Education's CIP taxonomy. NIH information on trends seen within these selected health fields can be found at https://report.nih.gov/nihdatabook/.
The full set of data tables from the 2018 survey are available at https://www.nsf.gov/statistics/srvygradpostdoc/. Data are also available in NCSES's interactive data tool (https://ncsesdata.nsf.gov/ids/gss). For more information about the survey, contact the GSS project officer, Michael Yamaner.
[1] Michael Yamaner, Human Resources Statistics Program, National Center for Science and Engineering Statistics, National Science Foundation, 2415 Eisenhower Avenue, Suite W14200, Alexandria, VA 22314 (myamaner@nsf.gov; 703-292-7815). Caren A. Arbeit, RTI International, Research Triangle Park, NC.
[2] National Science Board, National Science Foundation. 2019. Science and Engineering Indicators 2020: Science and Engineering Labor Force. Science and Engineering Indicators 2020. NSB-2019-8. Alexandria, VA. Available at https://ncses.nsf.gov/pubs/nsb20198/.
[3] Electronic data interchange is a method for transferring data between computer systems or networks using a standardized format.
[4] CIP is a taxonomy used for reporting postsecondary fields to the U.S. Department of Education (ED) for the Integrated Postsecondary Education Data System, a mandatory survey for institutions receiving federal financial aid. Thus, most of institutions in the GSS already use CIP codes to report data on graduate students. The CIP taxonomy was developed by the National Center for Education Statistics (within ED), which updates the taxonomy about once a decade; CIP was last revised in 2010. For more information, see http://nces.ed.gov/ipeds/cipcode/.