Division of Science Resources Studies |
|
 |
Directorate for
Social, Behavioral and Economic Sciences |
|
|
|
National Science Foundation
|
NSF 01-326, May 17, 2001
|
U.S. Industrial R&D Performers Report Increased R&D in 1999; New Industry Coding and Size Classifications for NSF Survey
Raymond M. Wolfe
Company funding of industrial R&D increased to $160.3 billion in 1999; Federal funding fell to $22.5 billion.
R&D-performing industries reported $5.9 trillion in sales and employed 22.9 million people in 1999.
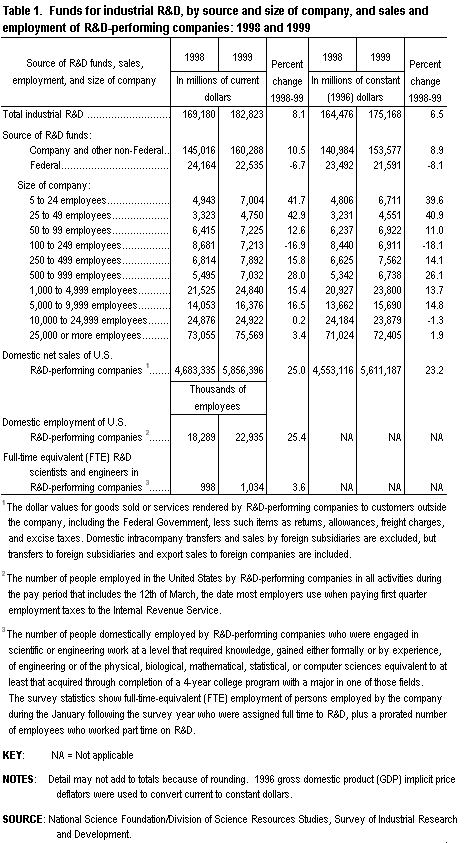
The National Science Foundation’s (NSF’s) 1999 Survey of Industrial Research and Development shows that companies[1] spent $182.8 billion on research and development (R&D) they performed in the United States, up 8 percent[2] over the 1998 figure. Company funding[3] of R&D continued to increase, as it has each year since 1953, rising from $145.0 billion in 1998 to $160.3 billion in 1999—an 11-percent increase. Federal funding of industrial R&D was $22.5 billion in 1999 compared with $24.2 billion in 1998. After adjusting for inflation, total industrial R&D rose 7 percent, company-funded R&D rose 9 percent, and federally funded R&D fell 8 percent.
Domestic net sales of companies that performed R&D in the United States rose from $4.7 trillion in 1998 to $5.9 trillion in 1999.[4] Domestic employment by companies that performed R&D in the United States rose from 18.3 million people in 1998 to 22.9 million in 1999. The number of full-time equivalent (FTE) scientists and engineers who performed industrial R&D remained unchanged, about 1.0 million in both years. Summary statistics from the 1998 and 1999 surveys are compared in table 1.
The North American Industrial Classification System
Beginning with the 1999 cycle, industry[5] statistics resulting from the Survey of Industrial Research and Development will be published using the North American Industrial Classification System (NAICS). The development of NAICS has been a joint effort of statistical agencies in Canada, Mexico, and the United States and the system replaces the Standard Industrial Classification (1980) of Canada, the Mexican Classification of Activities and Products (1994), and Standard Industrial Classification (SIC, 1987) of the United States.[6] NAICS was designed to provide a production-oriented system under which economic units with similar production processes are classified in the same industry. NAICS was developed with special attention to classifications for new and emerging industries, service industries, and industries that produce advanced technologies. NAICS not only eases comparability of information about the economies of the three North American countries, but it also increases comparability with the two-digit level of the United Nations’ International Standard Industrial Classification (ISIC) system. Important for the Survey of Industrial Research and Development is the creation of several new classifications that cover major performers of R&D in the U.S. Among manufacturers, the new computer and electronic products classification (NAICS 334) includes makers of computers and peripherals, semiconductors, and navigational and electromedical instruments. Among nonmanufacturing industries are information (NAICS 51) and professional, scientific, and technical services (NAICS 54). Information includes publishing, both paper and electronic, broadcasting, and telecommunications. Professional, scientific, and technical services includes a variety of industries. Of specific importance for the survey are engineering and scientific R&D services.
Effects of NAICS on Survey Statistics
The change in industry classification system does not affect the summary statistics given in this Data Brief. However, in more detailed tables produced from the survey, the industry categories differ from those produced from the survey’s 1998 and earlier cycles. For 1999, early release tables are available at http://www.nsf.gov/statistics/srs01410/. Among those tables classified by industry, statistics from the 1997 and 1998 cycles of the survey which were previously classified using the SIC system have been reclassified using the new NAICS codes. This has been done to provide a bridge for users who want to make year-to-year comparisons beyond the aggregate comparisons made here.
Size of Business Classifications
Another survey enhancement beginning with the 1999 cycle is an increase in the number of size of company categories used to classify survey statistics. The original 6 categories have been expanded to 10 to emphasize the role of small companies in R&D performance. During 1998, companies with fewer than 500 employees spent $30.2 billion on industrial R&D performed in the United States. During 1999, they spent $34.1 billion. Of this amount, as shown in table 1, 21 percent ($7.0 billion) was spent by the smallest companies (those with at least 5 but fewer than 25 employees). The statistics further show that there was more growth in the amount of R&D performed by smaller companies than in the amount performed by larger companies. The more detailed business size information also facilitates better international comparisons. Generally, statistics produced by foreign countries that measure their industrial R&D enterprise are reported with more detailed company size classifications at the lower end of the scale than U.S. industrial R&D statistics traditionally have been.[7] The new classifications of the U.S. statistics will enable more direct comparisons with other countries’ statistics.
Notes on Survey Methodology
Statistics resulting from the 1999 cycle of the survey benefit from recent efforts to strengthen statistics for industries that perform the greatest amounts of R&D while lessening coverage of industries that perform little or no R&D. Specifically, beginning with the 1998 survey, a new sampling approach was used for companies in industries that do not conduct large amounts of R&D. These companies were sampled at much lower rates than in prior surveys allowing companies that conduct relatively large amounts of R&D to be sampled at higher rates. This has shifted emphasis toward those industries crucial in developing strong, representative estimates of industrial R&D spending. This sampling approach and its effect on the resulting statistics are discussed in detail in the latest annual report, Research and Development in Industry: 1998 (NSF 01-305) at http://www.nsf.gov/statistics/nsf01305/ and in the forthcoming Research and Development in Industry: 1999.
Statistical Reports
This Data Brief provides statistics and information from the 1999 Survey of Industrial Research and Development. Seven early release tables are available at http://www.nsf.gov/statistics/srs01410/. The annual report, Research and Development in Industry: 1999, will be published later this year and will contain the full set of 48 tables available from the survey. The tables will present R&D statistics by industry, size of company, source of funds, character of R&D, R&D as a percentage of net sales, and R&D contracted to outside organizations and performed outside the United States. The report also will provide historical trends in R&D, sales and total employment of R&D-performing companies, employment of R&D scientists and engineers, statistics by state, and technical information on the survey sample, processing, and the new North American Industrial Classification System.
This Data Brief was prepared by:
Raymond M. Wolfe
Division of Science Resources Studies
National Science Foundation
4201 Wilson Boulevard, Suite 965
Arlington, VA 22230
703-292-7789
rwolfe@nsf.gov