| Division of Science Resources Studies | |
| DATA BRIEF |
Directorate for Social, Behavioral and Economic Sciences |
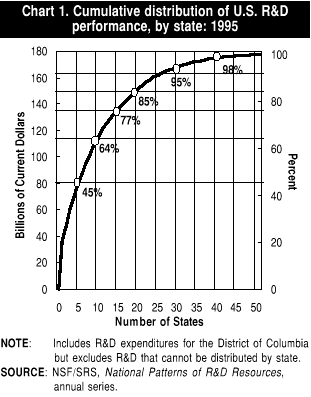
Six States Account for Half the Nation's R&D |
|
In 1995,-California, Michigan, New York, Massachusetts,
New Jersey, and Texas-the six states with the highest levels of R&D
expenditures accounted for approximately one-half of the national R&D
effort
|
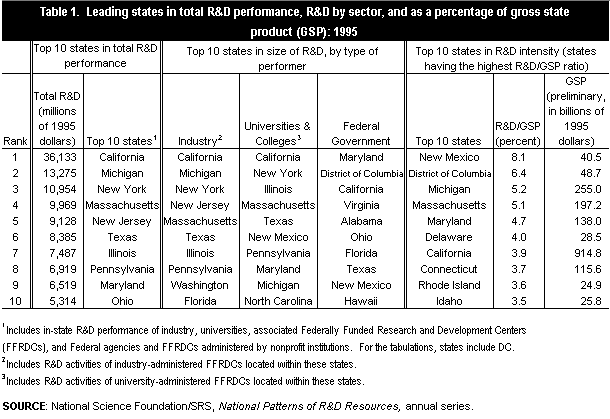
The National Science Foundation’s (NSF) Division of Science Resources Studies (SRS) collects and analyzes statistics on the geographic distribution of research and development (R&D) expenditures in the United States among the 50 states, the District of Columbia and Puerto Rico. The data are categorized by type of performer [industry, Federal Government, academia, Federally Funded Research and Development Centers (FFRDCs), and other nonprofit organizations] and by source of funds (industry, Federal Government, and academia).[1] Data pertaining to federally-funded R&D are further classified by the Federal agencies that provide the funding. The most recent R&D data available on a state-by-state basis are for 1995. [2] In that year, total R&D expenditures in the United States were $183 billion, of which $177 billion could be attributed to expenditures within individual states, with the remainder falling under an undistributed, “other/unknown” category. The statistics and discussion below refer to state R&D levels in relation to the distributed total of $177 billion. State Distribution of R&D States that are national leaders in total R&D performance are usually ranked among the leading sites in industrial and academic R&D performance (table 1). For industrial R&D, eight of the top ten States were among the top ten for total R&D, with Washington and Florida of the top industrial R&D states replacing Maryland and Ohio of the top total R&D states. For academic R&D, in comparison to total R&D, New Mexico and North Carolina likewise replaced New Jersey and Ohio. For Federal intramural research, there was less commonality with the top ten for total R&D. Only four states were found in both top-ten lists: Maryland, California, Ohio, and Texas. The six additions to the Federal intramural list, in descending order of Federal R&D performance, were Alabama, the District of Columbia, Florida, Hawaii, New Mexico, and Virginia. Maryland ranked first among Federal R&D performers, followed by the District of Columbia, California, and Virginia. The placement of Maryland, the District of Columbia, and Virginia among the top four in Federal R&D performance reflects the concentration of Federal facilities and administrative offices within the national-capital area. Alabama, Florida, and New Mexico rank among the highest in Federal R&D because of their relatively high shares of Federal space- and defense-related R&D. |
|
|
|
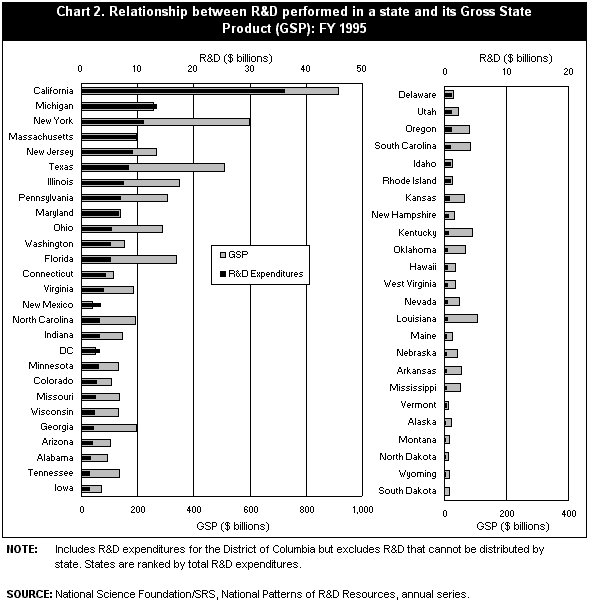
States vary greatly in terms of "R&D intensity"-the proportion of their economies devoted to R&D activities. |
Ratio of R&D to Gross State Product Chart 2 juxtaposes state R&D performance with GSP, with the 50 states and the District of Columbia ranked in descending order of R&D. R&D expenditures are displayed as a dark bar, measured on the upper axis; GSP is displayed as a wider gray bar measured on the lower axis; both are measured in billions. The two highest-ranked states in total R&D—California and Michigan—clearly show R&D levels that are relatively high in relation to their GSPs, which is confirmed by their presence in the top 10 list for R&D intensity (see table 1). New York ranked third in R&D performance, but had a relatively low (1.8 percent) R&D intensity. Thus, its third-place position in total R&D performance may be more closely associated with its economic size. The same may be said of Texas, Illinois, Pennsylvania, Ohio, and Florida. In contrast, Massachusetts, New Jersey, and Maryland are more like California and Michigan, with high R&D levels in relation to economic size. As can also be seen in Chart 2, states with relatively low levels of total R&D tend, on average, to have low R&D intensity, with the exceptions of Delaware, Idaho, and Rhode Island. South Dakota, with the lowest total R&D level, also had the lowest R&D intensity (0.3 percent). |
|
|
|
. |
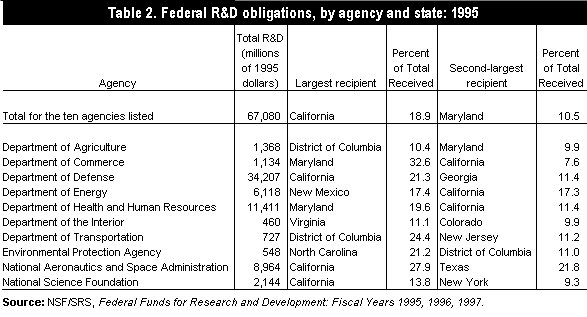
Federal Support for R&D |
|
|
|
. |
Science & Engineering Profiles User Notes:
For free copies of SRS Data Briefs, write to the above address or call (703) 306-1772 x-6938. |
[1] Data on industry R&D-and therefore total R&D-performance are not available for Puerto Rico.
[2] Data on the state location of industry-performed R&D are collected only for odd-numbered years. Data on the state location of Federal and academic R&D performance are collected annually aspart of the Federal Funds for Research and Development survey and the survey of R&D Expenditures at Universities and Colleges.