Directorate for Social, Behavioral
and Economic Sciences
NSF 98-319 July 20, 1998
| NATIONAL SCIENCE FOUNDATION Directorate for Social, Behavioral and Economic Sciences NSF 98-319 July 20, 1998 |
| by Lawrence M. Rausch |
 |
|
Global economic activity in high-tech industries was
especially strong
from 1992-95. |
|
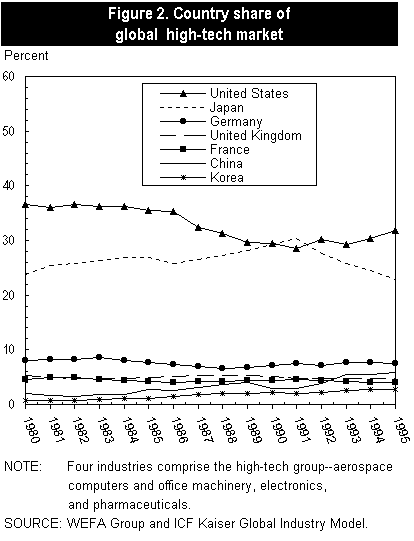
The United States was the leading producer of high-tech
products for 14 of the 15 years examined.
|
|
Economic Activity |
|
The global market for products manufactured by four research-intensive industries-aerospace, computers and office machinery, electronics and communications equipment, and pharmaceuticals-is growing more than twice as fast as that for other manufactured goods and is driving national economic growth around the world. Since 1980, their inflation-adjusted growth has averaged nearly 6 percent annually compared with a rate of 2.4 percent for other manufactured goods.[1] Global economic activity in high-tech industries was especially strong from 1992-95, when output grew at over 8 percent per year-again more than twice the rate of growth for all other manufacturing industries. The Organisation for Economic Co-operation and Development (OECD) identifies high-tech industries based on a comparison of industry R&D intensities, a calculation dividing industry R&D expenditures by industry sales. In 1995, the collective output of the four most R&D intensive high-tech industries-aerospace, computers and office machinery, electronics and communications equipment, and pharmaceuticals-represented 12.0 percent of world manufactured output, up from 7.6 percent in 1980.[2] How do high-tech industries benefit national economies? Nations seek to develop these R&D-intensive industries for several reasons:
During the 1980s, economic activity in the United States and other high-wage countries increasingly shifted toward the manufacture of higher value, technology-intensive goods (figure 1). In 1989, U.S. high-tech manufactures represented nearly 13 percent of total U.S. production of manufactured output, up from 10.4 percent in 1980. High-tech manufactures also accounted for growing shares of total production for European nations, but the transition to high tech in Europe during the 1980s was most prominent in the United Kingdom's economy. High-tech manufactures represented just 9 percent of the United Kingdom's total manufacturing output in 1980 but jumped to 13 percent by 1989. During the 1980s, output by Japanese high-tech industries increasingly became a larger part of its economy. In 1980, high-tech manufactures accounted for about 10 percent of total Japanese production, rose to 13 percent in 1984, and then increased to 15.3 percent in 1989. Data for the 1990s show an increased emphasis on manufacturing in the four high-tech industries among the major industrialized countries. In 1995, high-tech manufactures are estimated to represent 15 percent of manufacturing output in both the United States and Japan, 14 percent in the United Kingdom, and 10 percent each in France and Germany. Two other Asian countries, China and South Korea, typify how important these R&D-intensive industries have become to the newly industrialized economies. In 1980, high-tech manufactures accounted for just 4 percent of China's total manufacturing output; this proportion jumped to nearly 10 percent in 1989 and then reached 12.5 percent in 1995-more than for France or Germany. In 1995, high-tech manufacturing in South Korea accounts for about the same percentage of total output as in Japan and the United States (15 percent). How Prominent are U.S. High-Tech Industries In the Global Market? During the 1980s, the United States was the leading producer of high-tech products, responsible for over one-third of total world production from 1980 to 1986, and for about 30 percent of world production for the rest of the decade. While U.S. world market share declined some in the early 1990s, the downward trend reversed by 1992. The U.S. share of the world market for high-tech manufactures grew irregularly after 1991, and, by 1995, U.S. high-tech industries had regained much of the market share lost during the previous decade (figure 2). In 1995, production by U.S. high-tech industry accounted for nearly 32 percent of world high-tech production. How do High-Tech Industries in Other Countries Compare? Japanese high-tech industries followed a path of steady gains in world marketshare throughout the 1980s (figure 2). In 1989, Japan accounted for 28 percent of the world's production of high-tech products, moving up 4 percentage points since 1980. Japan continued to gain on the United States until 1991, when, for the first time, it eclipsed the United States to become the world's leading high-tech producer. Since then, however, Japan's market share has dropped steadily, falling to under 23 percent of world production in 1995 after accounting for more than 30 percent four years earlier. By comparison, European nations' share of world high-tech production is much lower. Germany produced about 8 percent of world high-tech production in 1980, under 7 percent in 1989, and nearly 8 percent once again by 1995. Shares for both France and the United Kingdom fluctuated between 4 and 5 percent throughout the 15-year period examined. China has made the most dramatic gains since 1980, although these gains were made in spurts. During the first half of the 1980s, China's market share moved downward, hovering around 2 percent of world high-tech production. By 1989, the country's share had doubled. After a one-year decline down to 2.9 percent in 1990, China's high-tech production increased sharply; by 1995, the country accounted for nearly 6 percent of world high-tech industry output.
|
|
.This Issue Brief was prepared by:
SRS data are available through the World Wide Web (http://www.nsf.gov/statistics/). For more information about obtaining reports, contact pubs@nsf.gov. or call (301) 947-2722. For NSF's Telephonic Device for the Deaf, dial (703) 306-0090. In your request, include the NSF publication number and title, your name, and a complete mailing address. |
Footnotes
[1] The data in this report are derived from the WEFA/ICF Global Industry Model database, which reports production data by 68 countries and accounts for over 97 percent of global economic activity. Technical information about the model can be found in WEFA Group (1997).
[2] In 1994, these four industries performed 45 percent of the R&D performed by manufacturers in a group of 15 advanced industrialized countries (OECD 15) and an estimated 48 percent of the R&D performed by U.S manufacturers.
References
Mansfield, E. 1991. "Academic Research and Industrial Innovation." Research Policy 20, No. 1 (February): 1-12.