All Images
Research News
A New Vision for Scientific Visualizations

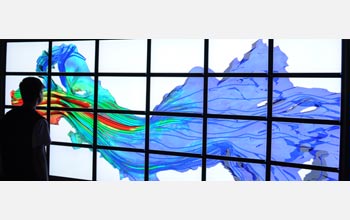
Using VisTrails, researchers can create large visualizations from complex data sets relatively easily and inexpensively. Here, a river is simulated based on sensor data. The various colors show water speed in different parts of the river.
Credit: Juliana Freire, University of Utah
Download the high-resolution JPG version of the image. (545 KB)
Use your mouse to right-click (Mac users may need to Ctrl-click) the link above and choose the option that will save the file or target to your computer.
An interview with Juliana Freire, one of the creators of VisTrails, a data visualization program. In recent decades, researchers have used computers to build complex visualizations based on large data sets to gain a better perspective on their research. Programming a computer to produce these visualizations is not an easy task, however. And as the amount of data collected in our world grows, the challenge of organizing all that information into an accurate and cohesive picture becomes even more difficult.
Enter VisTrails, an NSF-supported suite of visualization tools developed by Juliana Freire and Claudio Silva, both associate professors of computer science at the University of Utah. VisTrails makes it much easier for scientists to create complex visualizations, data mining and other types of large-scale data analysis applications by taking automating many of the difficult and time-consuming backend work that goes into producing them.
Credit: National Science Foundation; edited by Mike Sosinski

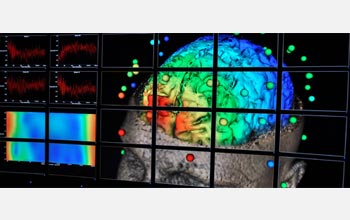
A visualization of the human brain using VisTrails. In recent decades, researchers have used computers to build complex visualizations based on large data sets to gain a better perspective on their research. When a computer combines a map with the data from thousands of sensors measuring ocean currents and temperatures around the globe, for example, a collection of numbers can become a stunning visualization that helps us understand shifting climate patterns. Likewise, a computer-generated visualization can help a surgeon better understand what is happening inside a patient's heart before ever picking up a scalpel.
Credit: Juliana Freire, University of Utah
Download the high-resolution JPG version of the image. (580 KB)
Use your mouse to right-click (Mac users may need to Ctrl-click) the link above and choose the option that will save the file or target to your computer.


