All Images
News Release 07-097
National Science Board Approves NSF Plan to Emphasize Transformative Research
This material is available primarily for archival purposes. Telephone numbers or other contact information may be out of date; please see current contact information at media contacts.

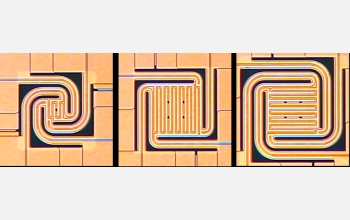
Microhotplates crafted of silicon carbide by Boston Microsystems, each consisting of a central plate surrounded by curved tethers. The largest is less than 100 microns (millionths of a meter) across.
These micro-hotplates--capable of reaching temperatures above 1100 degrees Celsius (2012 degrees Fahrenheit)--serve as a critical tool in developing new precision materials, some of which will enable the development of next-generation sensors. Already, the devices have led to new oxygen and engine emission sensors.
Boston MicroSystems, Inc. crafted the hotplates from silicon carbide because it is a robust material that can tolerate extreme heat and reach peak temperature in less than two-thousandths of a second. The tiny hotplates reside on a microchip within a transparent, polycarbonate chamber that can endure near-vacuum pressures. Ports in the chamber's sides allow gases to pass through to feed experiments, while researchers observe experiments in progress through a microscope.
The techniques necessary for crafting and optimizing these micro-electro-mechanical systems (MEMS) were developed with support from the National Science Foundation Small Business Innovation Research (SBIR) program and SBIR programs at the Department of Energy, Environmental Protection Agency and NASA. To learn more about this research, see NSF press release 04-900, Searing Heat, Little Package. (Date of Image: 2004)
Credit: Boston Microsystems, Inc.; National Science Foundation
Download the high-resolution JPG version of the image. (321 KB)
Use your mouse to right-click (Mac users may need to Ctrl-click) the link above and choose the option that will save the file or target to your computer.

This image depicts the self-assembly of gold-polymer nanorods into a curved structure. National Science Foundation (NSF)-supported research by Chad Mirkin at Northwestern University has generated nanostructures with the ability to curve. These are the first nanostructures to exhibit this ability -- a critical requirement for the utility of nanomaterials in further applications including drug-delivery systems, nanoscale electronics, catalysts and light-harvesting materials. NSF is the lead agency for the National Nanotechnology Initiative, a multiagency network working to bolster nanotechnology and ensure U.S. dominance in this emerging field. Strong research efforts are critical to capitalize on nanotechnology's potential to revolutionize science and engineering and to harness all that it offers.
Inspired by the molecular assembly techniques used in living cells, chemist Chad Mirkin and his colleagues at Northwestern University have created a new class of nanometer-scale building blocks that can spontaneously assemble themselves into ultra-tiny spheres, tubes and curved sheets.
This is the first time that scientists have been able to make structures on this scale that curve in any fashion, as opposed to being straight or flat. Since the Mirkin group can also control the size and curvature of their structures very accurately, the technology could eventually lead to important applications in nanoscale electronics and drug-delivery systems.
Mirkin and his colleagues were supported in part by the National Science Foundation (NSF), and published their discovery in the 16 January 2004 issue of the journal Science. A press release detailing their work is available from Northwestern here. (Date of Image: Dec. 2003)
Credit: Chad Mirkin, Northwestern University
Download the high-resolution JPG version of the image. (1 MB)
Use your mouse to right-click (Mac users may need to Ctrl-click) the link above and choose the option that will save the file or target to your computer.

Scalable Visualization Using Grids. A simulation showing ground wave action as shock waves travel under the ocean, passing Catalina Island (in blue, upper right). View from underground level, looking south. This simulation, known as TeraShake, used the new 10 teraflops DataStar supercomputer and large-scale data resources of the San Diego Supercomputer Center (SDSC) at the University of California, San Diego.
Distributed interactive volume browsing with the Grid Visualization Utility, using the Globus Toolkit and a point-sampling technique to accelerate exploration of very large datasets. Showing the Terashake-2.1 simulation depicting a velocity wavefield as it propagates through the 3-Dimensional velocity structure beneath Southern California. The warmer red and yellow colors indicate regions of compression, while the cooler blue and green colors show regions of dilation. Faint yellow (faults), red (roads) and blue (coast-line) lines add geographical context.
Areas of this research are supported by National Science Foundation grant EAR 01-22464 (Earth Sciences Division), "The SCEC Community Modeling Environment (SCEC/CME): An Information Infrastructure for System-level Earthquake Research;" and grant ANI 02-25642 (Information Technology Research program), "The OptiPuter Project: A Powerful Distributed Cyberinfrastructure to Support Data-Intensive Scientific Research and Collaboration." The OptIPuter is a computing paradigm in which dynamically controllable optical networks become the system bus that connects cluster computers as if they were giant peripherals in a planetary-scale computer. The SCEC award is to develop computing capabilities to better forecast when and where earthquakes are likely to occur in southern California and how the ground will shake as a result; and develop the ability for scientists to improve computer models of how the Earth is structured and how the ground moves during earthquakes. For more information, visit the SCEC Web site. (Date of Image: July 2006)
Credit: Marcus Thiebaux, Information Sciences Institute, USC
Download the high-resolution JPG version of the image. (1 MB)
Use your mouse to right-click (Mac users may need to Ctrl-click) the link above and choose the option that will save the file or target to your computer.


