



TIP Investment Explorer user guide
The U.S. National Science Foundation Directorate for Technology, Innovation and Partnerships (NSF TIP) launched the TIP Investment Explorer, to provide an interactive view of NSF TIP investments across the United States. The platform enables users to explore awards, contracts, organizations, principal investigators, and investment impacts through intuitive map-based and data-driven visualizations.
Built on Elsevier’s Pure platform, the TIP Investment Explorer combines data from multiple trusted sources to provide a centralized view of NSF TIP investments. The platform supports exploration of awards across Key Technology Areas (KTAs), TIP programs, geographic regions, organization types, and impact metrics, helping users better understand the breadth and outcomes of NSF TIP investments.
The TIP Investment Explorer will continue to evolve as additional data sources, programs, and visualization capabilities become available.
About the data
The TIP Investment Explorer contains data from multiple authoritative sources to provide a comprehensive view of NSF TIP investments.
The platform currently includes:
- Research and development awards and contracts that were active beginning in Fiscal Year (FY) 2022 through the present.
- Subawardee data are drawn from USASpending.
- Organization Type data for both awardee and subawardee organizations are drawn from Sam.gov.
- Researcher profile information is provided by Elsevier. New profiles are updated weekly.
- Impact view metrics reflect awards through FY2025 as of the latest quarterly refresh.
- Impact view metrics are refreshed quarterly using the latest approved impact data files. Metrics reflect the most recent available reporting period and may change as new impact data become available.
TIP Investment Explorer
Quick Start Guide
Awards by Key Technology Area
Awards by Programs
The Map View provides an interactive geographic representation of NSF TIP investments across the United States. Users can explore awards and contracts by applying filters and selecting geographic regions.
Users can filter investments by:
- Active Fiscal Year
- Start Fiscal Year
- Key Technology Area
- Technology Focus (Sub-KTA)
- TIP Program
- TIP Sub-Programs
- Established Program to Stimulate Competitive Research (EPSCoR) Status
Additional Investment categories include:
- Scaling Technology Capacity
- Emergent Technologies
- Supporting Activities
Technology Focus (Sub-KTA) classifications provide a more detailed breakdown of Key Technology Areas, allowing users to perform more granular searches and improve award discoverability and reporting.
Awards and contracts may be associated with multiple Key Technology Areas. As a result, investments may appear in more than one category when filtering by technology area.
The map reflects the current Congressional District boundaries published by the U.S. Census Bureau.
Investment amounts displayed throughout the application represent the Total Intended Award Amount. Displayed investment values should not be used to calculate NSF budget allocations because continuing grants, supplements, and award modifications may affect total funding values over time.
Map symbols explained
The Map View uses symbols to represent different types of organizations and investment relationships.
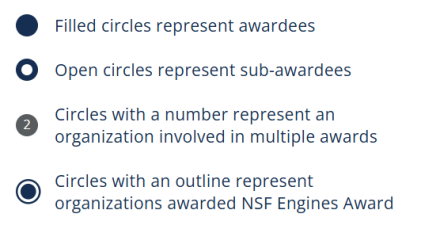
- Each point on the map represents an organization.
- Filled circles represent organizations receiving an NSF TIP award/contract.
- Open circles represent organizations participating as subawardees.
- Circles with a number represent an organization involved in multiple awards.
- Circles with an outline represent organizations awarded an NSF Engines Award.
How to view organization and award details on the map
Hover over a map point to view details, including organization name, organization type, award or contract title and award or subaward designation.
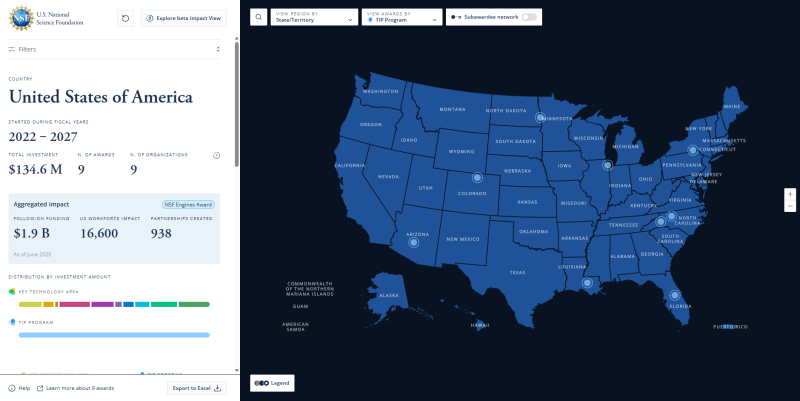
N. of Awards in the side panel reflects the total awards and contracts for the filters applied. This total does not include subawards.
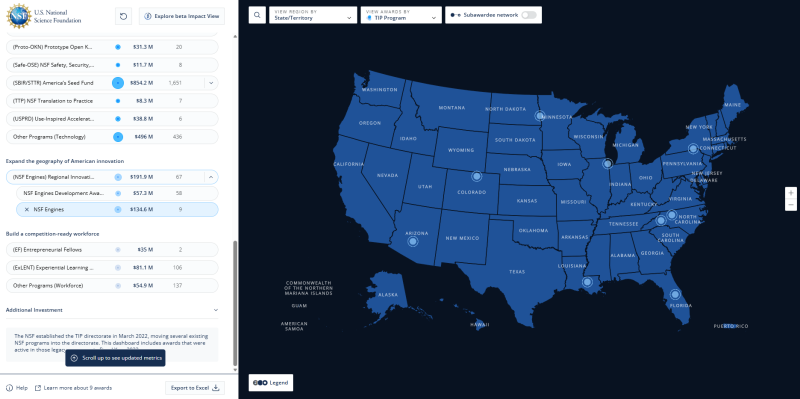
For NSF Engines awards, additional aggregated impact metrics are available in the Aggregate Impacts summary panel.
To view these metrics:
- In the left navigation panel, expand TIP Program.
- Scroll to Regional Innovation Award Engines and select the arrow to expand the program.
- Select the NSF Engines subprogram.
- The Aggregate Impacts summary updates to display the following additional metrics:
- Follow-on Funding
- Workforce Impact
- Partnerships Created
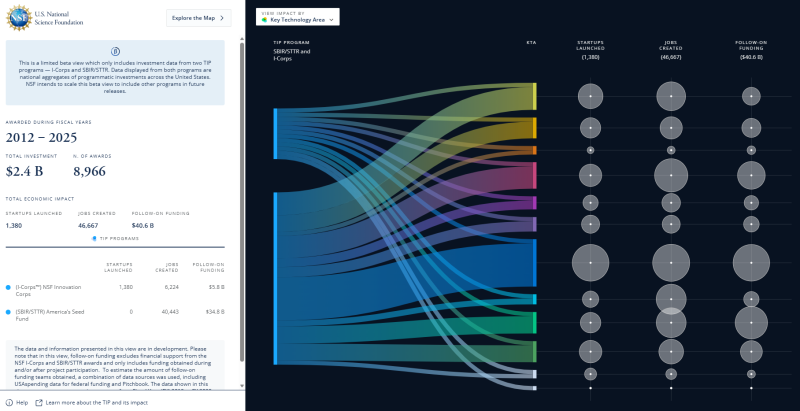
The TIP Impact View dashboard displays the economic impact of TIP programs across the U.S. Users can analyze impact by Key Technology Area or TIP program. Results are displayed in a Sankey graph showing the flow of investments and outcomes.
Additional TIP programs and impact metrics may be incorporated into the Impact View over time as data becomes available.
Key metrics include startups launched, jobs created and follow-on funding. These data points are summarized alongside total awards and investment amounts. Additional panels provide program details, funding notes and interactive options to explore the data further. The TIP Investment Explorer includes NSF investments in NSF Innovation Corps (I-Corps™) national teams and America's Seed Fund, powered by NSF, also known as the Small Business Innovation Research/Small Business Technology Transfer (SBIR/STTR) programs from FY 2012-2024. Data will be updated quarterly, and additional programs will be added over time.
Users can export the currently displayed results from the Map to Microsoft Excel.
To export data:
- Apply the desired filters.
- Select Export to Excel at the bottom of the left navigation panel.
- Open the downloaded Excel workbook.
The exported file reflects the records currently displayed based on the selected filters.
Where applicable, exported files may include award records, contract records, and subaward records. Because exports may include subaward records, the total number of rows in the exported workbook may differ from the Number of Awards displayed in the application.
This difference is expected because:
- The application displays the number of awards and contracts.
- The exported workbook may contain multiple rows representing participating subawardee organizations.
What's included in the Excel export
- Award/contract ID
- Award/contract title
- Award/contract abstract
- Organization and lead/subawardee designation
- Total Investment (for prime and subawardees)
- NSF award URL
- Award start and end date
- PI and Co-PI names
- State, congressional district, county and Core-Based Statistical Area (CBSA)
- TIP program(s) award is part of
- Key Technology Area(s)
- Program status (active/inactive)
- NSF EPSCoR
- Portal URL
- Contract records (where applicable)
- Network-related organization relationship data (where applicable)
TIP Programs and Sub-Programs can be selected from either the Map View or the Awards page within the database portal.
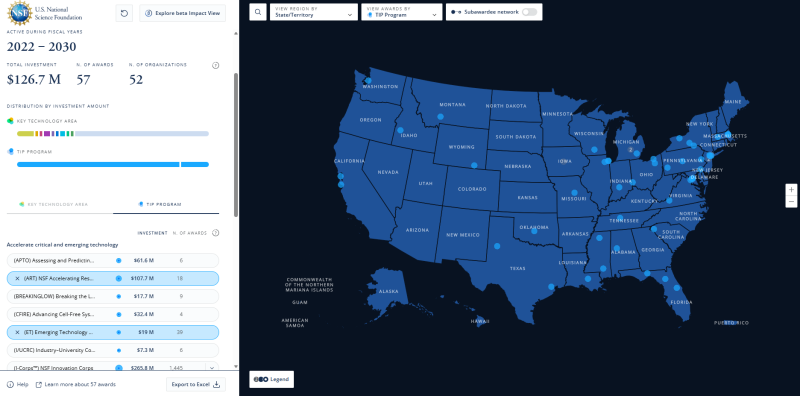
On the map, to search by TIP Program:
- Open the TIP Program filter.
- Select one or more TIP Programs.
- The map and summary statistics automatically update to reflect the selected programs.
Sub-Programs
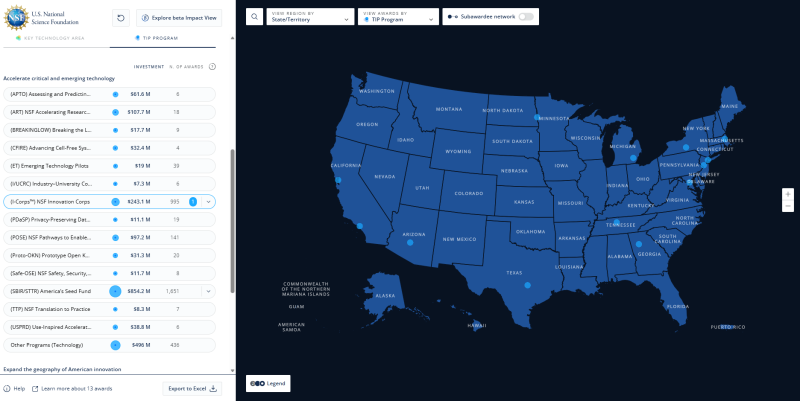
Program filtering is expanded by sub-program drill-downs.
Sub-program filtering allows users to perform a more precise search within TIP programs.
Key behaviors include:
- Selecting a parent program automatically includes all sub-programs.
- Awards may belong to only one sub-program within a program
- Example: An award in the I-Corps program can either belong to the I-Corps Teams or I-Corps Hubs sub-program.
- If multiple sub-programs are selected within a parent program, the collapsed view of the parent program will show the number of sub-programs selected within that program.
Users may further refine results by selecting one or more Key Technology Areas (KTAs).
Database Portal
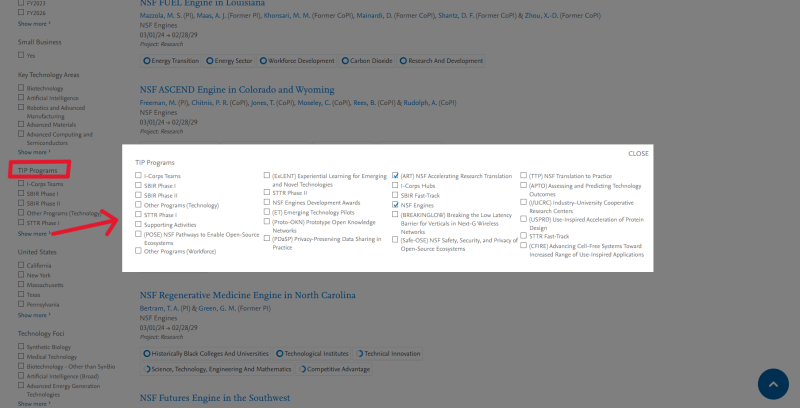
Users may also search by TIP Program directly from the Awards page by selecting one or more TIP Programs within the TIP Program filter.
Searching by KTA can be done on the map or on the database portal.
Map View
To search by KTA:
- Open the Key Technology Area filter.
- Select one or more KTAs.
- The map automatically refreshes to display matching awards.
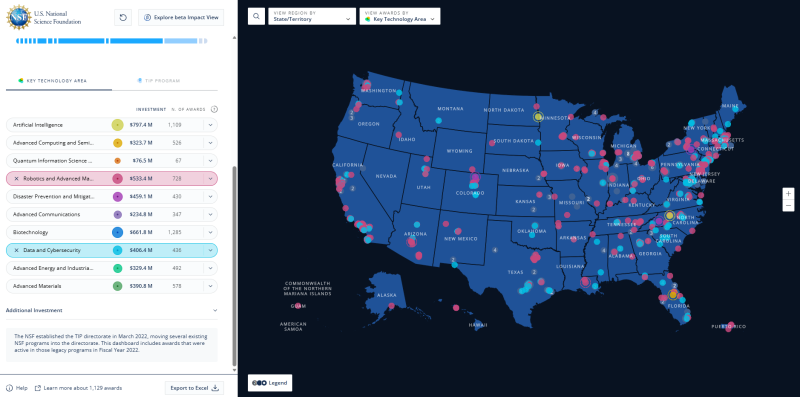
Users may further refine results by selecting one or more TIP Programs.
Technology Focus (Sub-KTA)
KTA filtering is expanded by Technology Focus (Sub-KTA) classifications.
Technology Focus enables users to perform more detailed searches within each KTA.
Key behaviors include:
- Selecting a parent KTA automatically includes all associated Technology Focus categories.
- Awards may belong to multiple KTAs.
- Awards may belong to multiple Technology Focus classifications.
- Awards are categorized using approved NSF tagging rules.
- If multiple sub-KTAs are selected within a KTA, the collapsed view of the parent KTA will show the number of sub-KTAs selected within that KTA.
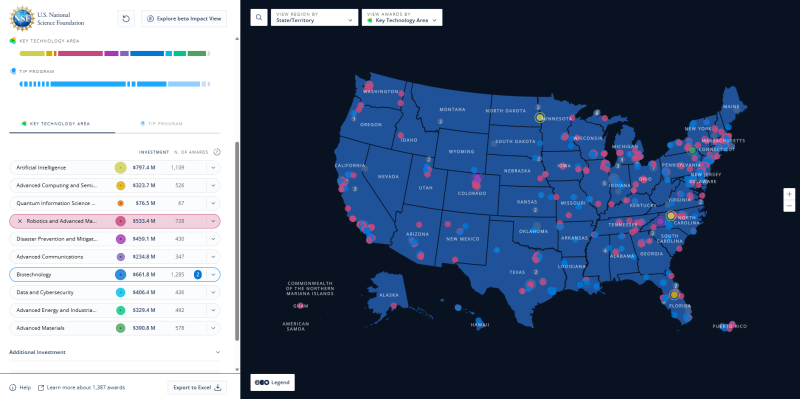
Understanding filter logic for TIP Programs/Sub-Programs and KTAs/Sub-KTAs
You can combine filters to narrow your search results. When multiple filters are applied, the TIP Investment Explorer uses the following logic:
- Multiple selections within the same filter category use OR logic.
- Example: Selecting TIP Programs, “NSF Engines” and “I-Corps” returns awards belonging to either program.
- Selections across different filter categories use AND logic.
- Example: Selecting TIP Program, “NSF Engines” and KTA, “Artificial Intelligence” returns awards that belong to NSF Engines and Artificial Intelligence.
When users open a shared TIP Investment Explorer URL, the application automatically restores the associated filters and view settings where supported.
Shared URLs may preserve:
- Selected TIP Programs
- Selected KTAs
- Geographic selections
- View state
- Supported visualization settings
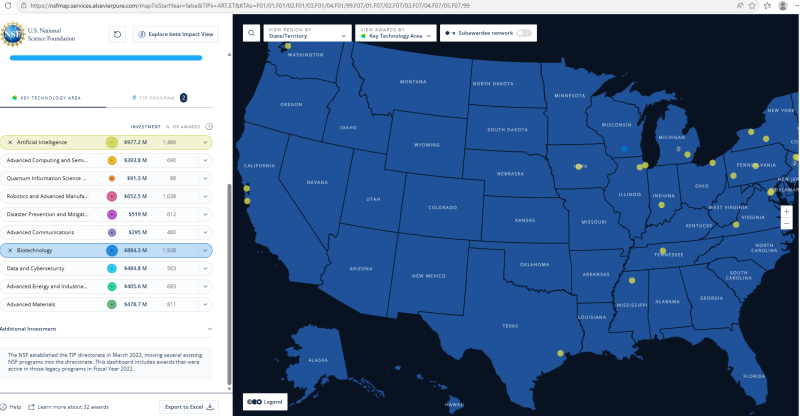
The TIP Investment Explorer enables users to explore awards and contracts geographically through the interactive Map View. Users can search by state, congressional district, county, or Core-Based Statistical Area (CBSA).
Selecting a geographic region automatically updates the map and summary statistics to display the awards, organizations, and investment totals associated with the selected area.
Search by State
To view awards within a specific state:
- Select a state directly from the map.
- The map and summary panel update automatically to display the organizations, awards, contracts, and investment amounts associated with the selected state.
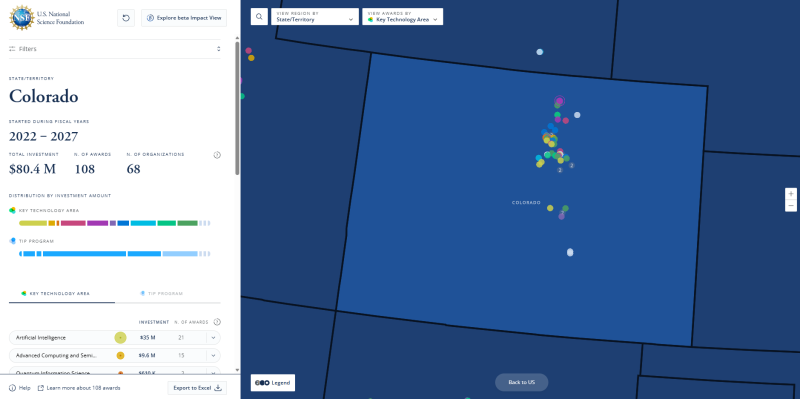
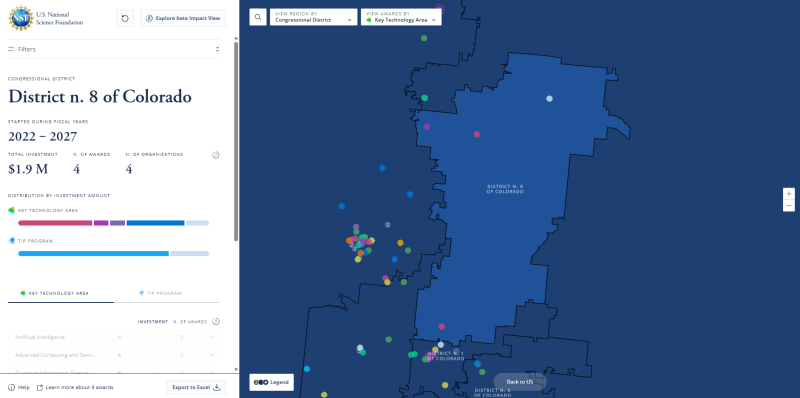
Search by Congressional District
To refine results by congressional district:
- Select Congressional District from the View Region By drop-down menu.
- Select a congressional district directly on the map.
The application updates the displayed organizations and investment statistics for the selected district.
Search by County or Core-Based Statistical Area (CBSA)
To search by county or CBSA:
- Select a state.
- Choose County or Core-Based Statistical Area (CBSA) from the View Region By menu.
- Select the desired county or CBSA.
The displayed awards and investment summaries update automatically.
Search Using the Search Bar
Users may also search for geographic locations using the search box located in the upper-left corner of the Map View.
Supported searches include:
- State
- Territory
- County
- Core-Based Statistical Area (CBSA)
Select the desired location from the search suggestions to update the map.
To return to the national view, select Back to U.S.
Subawardee Network Visualization
This version introduces Subawardee Network Visualization.
Users may:
- Show Subawardee Network
- Hide Subawardee Network
- Display relationships between awardees and subawardees
- View relationship lines directly on the map
Subawardee Network Visibility Rules
Version 2.0 introduces the following subawardee network behavior:
- When network visualization cannot be displayed, the application provides explanatory guidance.
- Users may continue exploring investment data without displaying the subawardee network.
These behaviors help maintain map readability when large numbers of organizations are selected.
The database portal provides multiple methods for locating awards and researchers.
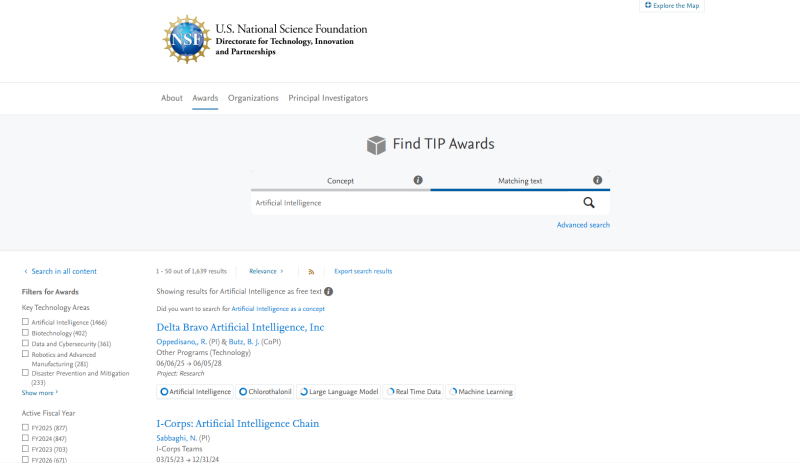
Free Text Search
Users can search using keywords, organization names, investigator names, project titles, or other descriptive terms.
To perform a free text search:
- Navigate to the database portal.
- Enter one or more keywords in the search box.
- Select the desired result.
Free text search
Concept Search
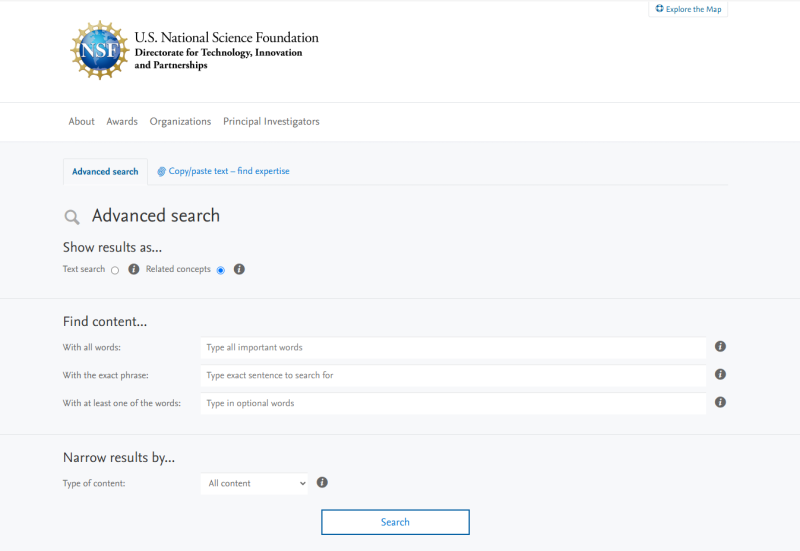
Concept Search uses Elsevier’s semantic indexing capabilities to identify awards that are conceptually related rather than relying solely on keyword matches.
To perform a Concept Search:
- Navigate to the database portal
- Select Advanced Search.
- Select Related Concepts as the search method.
- Enter one or more concepts.
- Select Search.
Concept Search is particularly useful when searching across broad scientific topics or related research areas.
Ten Key Technology Areas (KTAs) are crucial for the nation's economic and national security. TIP utilizes state-of-the-art machine learning to label awards with the corresponding KTA, ensuring a clear association between TIP awards and respective KTA. TIP has further broken down the KTA into 47 Technology Foci to better sort and filter awards.
Technology Focus (Sub-KTA) filtering has been expanded to improve award classification, searchability, and reporting.
Awards may appear in multiple KTA and Technology Focus categories based on approved tagging rules.
KTA1 — Artificial Intelligence
KTA1.1 Artificial intelligence (excluding ML)
KTA1.2 Machine learning (ML)
KTA1.3 Machine learning training data
KTA1.4 Autonomy
KTA1.5 Artificial Intelligence (Broad)
KTA2 — Advanced Computing and Semiconductors
KTA2.1 High-performance computing (HPC)
KTA2.2 Advanced computer hardware
KTA2.3 Advanced computer software
KTA2.4 Semiconductors
KTA2.5 Advanced Computing and Semiconductors (Broad)
KTA3 — Quantum Information Science and Technology
KTA3.1 Quantum computing algorithms and software
KTA3.2 Quantum computing hardware
KTA3.3 Quantum communications and networking
KTA3.4 Quantum sensing
KTA3.5 Quantum device components and manufacturing methods
KTA3.6 Quantum Information Science and Technology (Broad)
KTA4 — Robotics and Advanced Manufacturing
KTA4.1 Robotics
KTA4.2 Automation
KTA4.3 Advanced manufacturing (excluding biomanufacturing and semiconductor manufacturing)
KTA4.4 Robotics and Advanced Manufacturing (Broad)
KTA5 — Disaster Prevention and Mitigation
KTA5.1 Natural disaster prevention and mitigation (excluding climate resilience)
KTA5.2 Climate resilience
KTA5.3 Anthropogenic disaster prevention and mitigation (excluding pandemics)
KTA5.4 Pandemic prevention and response
KTA5.5 Disaster Prevention and Mitigation (Broad)
KTA6 — Advanced Communications
KTA6.1 Wireless communication — terrestrial and space
KTA6.2 Wired and fiber communication
KTA6.3 Spectrum management
KTA6.4 Communications and network security
KTA6.5 Internetworking
KTA6.6 Immersive technology and edge devices
KTA6.7 Advanced Communications (Broad)
KTA7 — Biotechnology
KTA7.1 Biotechnology — other than synthetic biology
KTA7.2 Medical technology
KTA7.3 Genomics and bioinformatics
KTA7.4 Synthetic biology
KTA7.5 Biomanufacturing
KTA7.6 Biotechnology (Broad)
KTA8 — Data and Cybersecurity
KTA8.1 Data storage
KTA8.2 Data management and databases
KTA8.3 Data privacy
KTA8.4 Distributed ledger technologies
KTA8.5 Cybersecurity
KTA8.6 Biometrics
KTA8.7 Data and Cybersecurity (Broad)
KTA9 — Advanced Energy and Industrial Efficiency Technologies
KTA9.1 Advanced batteries and energy storage technologies
KTA9.2 Advanced energy generation technologies
KTA9.3 Advanced transmission and distribution systems
KTA9.4 Carbon management technologies
KTA9.5 Advanced nuclear technologies
KTA9.6 Industrial efficiency technologies
KTA9.7 Advanced Energy and Industrial Efficiency Technologies (Broad)
KTA10 — Advanced Materials
KTA10.1 Composites (excluding 2D materials)
KTA10.2 2D materials
KTA10.3 Other next-generation materials
KTA10.4 Related manufacturing technologies
KTA10.5 Advanced Materials (Broad)
A distinguishing feature of the Pure platform is the Elsevier Fingerprint Engine (Engine), which mines the text of public scientific documents, such as publication abstracts, funding announcements, patents and awards, to create an index of weighted terms that defines the text-fingerprint visualization.
From a cluster popup, ‘Click to view awards’ routes to Pure: if Subaward = OFF, results show main‑awardee awards only; if Subaward = ON, results show any participant (main or subaward) awards
Indexing
By compiling and comparing fingerprint indexes, the Engine enables institutions to look beyond metadata and find valuable connections among people, publications, funding opportunities and ideas. The Engine powers many Elsevier solutions, including Pure and Expert Lookup, an Elsevier tool for finding reviewers, to inform decision-making.
Thesauri
Using a wide collection of thesauri, the Engine can support applications pertaining to multiple subject areas. This allows Elsevier to develop solutions for researchers in the life sciences, engineering, Earth and environmental sciences, arts and humanities, social sciences, mathematics, agriculture and more.
How it works
The Elsevier Fingerprint Engine creates indexes in the following steps:
- The Engine applies a variety of natural language processing techniques to mine the text of scientific documents, including publication abstracts, funding announcements, awards, project summaries, patents, proposals, applications and other sources.
- The Engine identifies key concepts that define the text using thesauri spanning major disciplines.
- The Engine creates an index of weighted terms that defines the text, known as a Fingerprint index
Active FY: The federal government fiscal year(s) during which an organization receives NSF funding for an award or contract. An award beginning Oct. 1, 2025, and ending April 1, 2027, has the following active FYs: FY 2026, FY 2027.
Award or contract status: Indicates whether the organization has received NSF funding. An organization can have multiple awards or contracts with NSF.
Active: the organization is receiving NSF funds or is operating under a "no-cost extension" to complete the project.
Additional Investment Categories: Version 2.0 introduces additional investment classifications that complement, but do not replace, Key Technology Areas (KTAs).
Current categories include:
- Scaling Technology Capacity
- Emergent Technologies
- Supporting Activities
These categories provide additional ways to explore NSF TIP investments.
Aggregated Impact Metrics: Metrics that summarize the collective outcomes of supported NSF Engines investments.
Where applicable, aggregated metrics may include:
- Follow-on Funding
- Workforce Impact
- Partnerships Created
Congressional District: A geographic area represented by one member of the U.S. House of Representatives.
Core-Based Statistical Area (CBSA): A geographic region defined by the Office of Management and Budget (OMB) consisting of one or more counties centered around an urban area. OMB generally defines a CBSA as an area that contains a central county that has a substantial urban population, along with any adjacent communities that have a high level of integration with the central county. In 2020, OMB defined CBSAs to consist of a county or multiple counties (or other equivalent entities) that contain a core urban area with a minimum population of 10,000.
County: Counties are the primary political and administrative divisions of States.
Emergent Technologies: Technology areas that are rapidly developing and expected to have significant future impact.
Exploratory activities: Early-stage efforts that assess new concepts and inform future research and technology development.
Finished: the organization is no longer receiving NSF funding, and the award has been officially closed out or "closed" in NSF systems.
Fiscal year (FY): The federal government's fiscal year runs from Oct. 1 to Sept. 30. For example, FY 2023 is Oct. 1, 2022, to Sept. 30, 2023.
Follow-on Funding: Additional funding received after the initial NSF award.
This may include:
- Public funding
- Private investment
Jobs Created: Employment opportunities generated through NSF-supported investments.
Metropolitan statistical areas: Metropolitan statistical areas have at least one urbanized area of 50,000 or more population, plus adjacent territory that has a high degree of social and economic integration with the core as measured by commuting ties.
Micropolitan statistical areas: Micropolitan statistical areas have at least one urban cluster of at least 10,000 but less than 50,000 population, plus adjacent territory that has a high degree of social and economic integration with the core as measured by commuting ties.
Not started: the award has been made, but the organization cannot collect NSF funding until a set start date is shown for each award.
NSF Engines Award: An NSF award identified as part of the NSF Engines program.
NSF EPSCoR: The Established Program to Stimulate Competitive Research (EPSCoR) supports research competitiveness in eligible jurisdictions.
The EPSCoR filter available in the TIP Investment Explorer is synchronized with the corresponding filter in the database portal.
For more information about EPSCoR, visit https://www.nsf.gov/funding/initiatives/epscor
Scaling technology capacity: Activities that strengthen the infrastructure, capabilities, and translational pathways needed to mature technologies for broader deployment.
Start FY: When the award began, in terms of the federal government's fiscal year. For example, the start FY for an award beginning Oct. 1, 2025, is FY 2026.
Startups launched: Companies formed as a result of NSF-supported research and innovation.
Subaward: An agreement that a prime recipient makes with another entity to perform a portion of their award.
Subawardee Network: A Version 2.0 visualization that displays relationships between awardee and subawardee organizations. Users may enable or disable the visualization using the Subawardee network toggle.
Technology Focus (Sub-KTA): A more detailed classification within a Key Technology Area (KTA). Technology Focus enables users to perform more granular searches while recognizing that awards may belong to multiple KTAs and multiple Technology Focus classifications.
The TIP Investment Explorer is built on Elsevier’s Pure platform, a commercial research information management system that has been configured to support the needs of the U.S. National Science Foundation Directorate for Technology, Innovation and Partnerships (NSF TIP). Because the Explorer is built on a commercial platform rather than custom-developed specifically for TIP, some functionality is determined by the underlying platform architecture and cannot currently be customized.
Current limitations include:
- Navigation panel – Categories and filters displayed in the left navigation panel of PURE Portal cannot currently be removed, reordered, or hidden.
- Principal Investigator (PI) affiliations – PI affiliations displayed in researcher profiles in PURE Portal are derived from Elsevier Pure and may differ from affiliations shown in other Elsevier products, such as Scopus.
- Export Search Results – The Export Search Results in PURE Portal feature is limited to 50 records per export and includes a predefined set of fields that cannot currently be customized.
- Beta Impact View – The Impact View on TIP Investment Explorer is currently in beta and only supports approved TIP programs for which impact data are available (SBIR/STTR and I-Corps). Additional programs and metrics will be incorporated as data become available.
Please note that not all functionality of the TIP Investment Explorer is final. Additional features will be added in the future.
Contact Us
Share your feedback with TIP by emailing tip@nsf.gov.