All Images
News Release 16-025
Fighting food poisoning in Las Vegas with machine learning
University of Rochester-developed app helps health departments track foodborne illnesses and improves inspections
This material is available primarily for archival purposes. Telephone numbers or other contact information may be out of date; please see current contact information at media contacts.

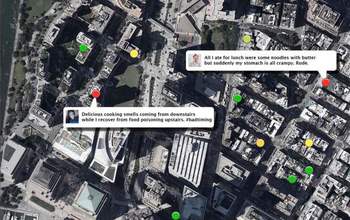
nEmesis continuously collects tweets throughout Las Vegas and connects the tweets to food venues. These tweets are evaluated by the language model to determine which are self-reports of symptoms of foodborne illness.
Credit: Adam Sadilek, University of Rochester
Download the high-resolution JPG version of the image. (159.3 KB)
Use your mouse to right-click (Mac users may need to Ctrl-click) the link above and choose the option that will save the file or target to your computer.
An animation shows the ability to interpolate an individual's movement over time using social media. Each pin represents a user.
Credit: Adam Sadilek, University of Rochester

nEmesis web interface. The top window shows a portion of the list of food venues ranked by the number of tweeted illness self-reports by patrons. The bottom window provides a map of the selected venue and allows the user to view the specific tweets that were classified as illness self-reports.
Credit: Adam Sadilek, University of Rochester
Download the high-resolution JPG version of the image. (64.0 KB)
Use your mouse to right-click (Mac users may need to Ctrl-click) the link above and choose the option that will save the file or target to your computer.

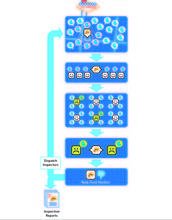
Adaptive inspection process. Starting from the top: all tweets geotagged in the Las Vegas area are collected. Tweets geotagged within 50 meters of a food venue are snapped to that venue, and the Twitter IDs of the users are added to a database of users to be tracked. All tweets of tracked users are collected for the next five days, whether or not the users remain in Las Vegas. These tweets are evaluated by the language model to determine which are self-reports of symptoms of foodborne illness. Venues are ranked according to the number of patrons who later reported symptoms. Health department officials use the nEmesis web interface
to select restaurants for inspection. Inspectors are dispatched to the chosen restaurants, and findings reported.
Credit: Adam Sadilek, University of Rochester
Download the high-resolution JPG version of the image. (332.7 KB)
Use your mouse to right-click (Mac users may need to Ctrl-click) the link above and choose the option that will save the file or target to your computer.

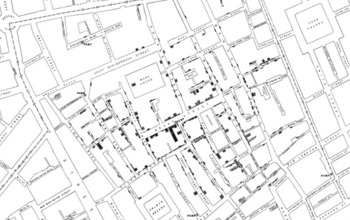
Original map made by John Snow in 1854. Cholera cases are highlighted in black. One of the first examples of location-based epidemiology.
Credit: Published by C.F. Cheffins, Lith, Southhampton Buildings, London, England, 1854 in Snow, John. On the Mode of Communication of Cholera, 2nd Ed, John Churchill, New Burlington Street, London, England, 1855.
Download the high-resolution PNG version of the image. (1.6 MB)
Use your mouse to right-click (Mac users may need to Ctrl-click) the link above and choose the option that will save the file or target to your computer.

The top 20 most significant negatively and positively weighted features in the researchers' language model.
Credit: Adam Sadilek, University of Rochester
Download the high-resolution JPG version of the image. (175.0 KB)
Use your mouse to right-click (Mac users may need to Ctrl-click) the link above and choose the option that will save the file or target to your computer.


