


Citizenship
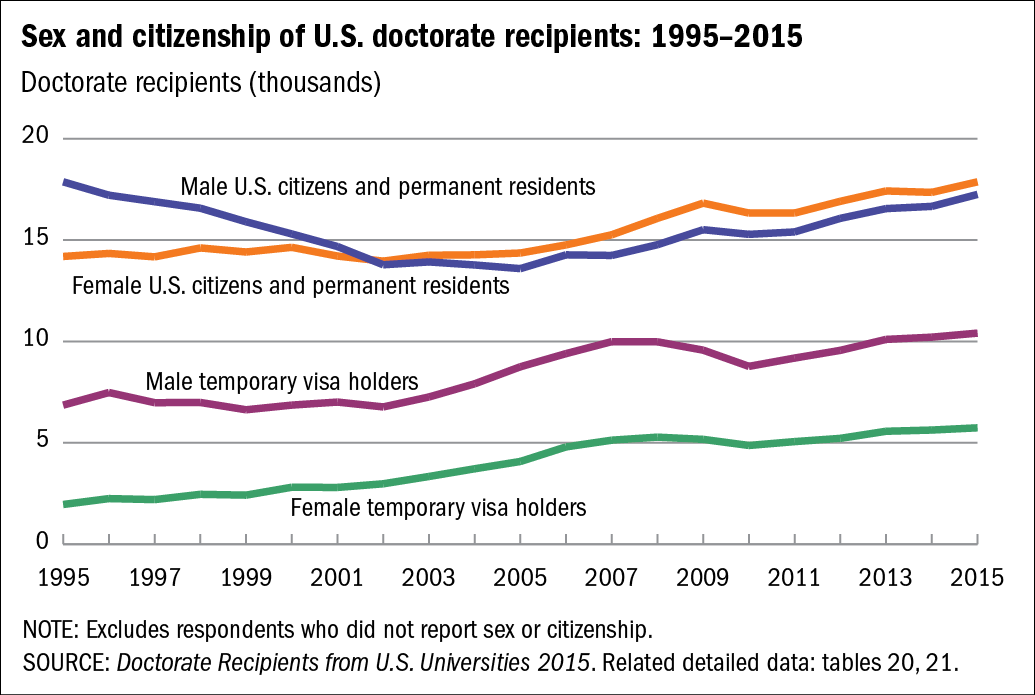
Women earned a majority of all doctorates awarded to U.S. citizens and permanent residents each year since 2002, and they earned more than one-third of all doctorates awarded to temporary visa holders over that period. From 1995 to 2006, the share of female doctorate recipients grew from 44% to 51% among U.S. citizens and permanent residents and from 22% to 34% among temporary visa holders. Since 2006, the shares of female doctorates in both citizenship categories have changed little. Overall, 46% of all doctorates in 2015 were awarded to women (figure D).
Sex and citizenship of U.S. doctorate recipients: 1995–2015
| Year | Male U.S. citizens and permanent residents | Male temporary visa holders | Female U.S. citizens and permanent residents | Female temporary visa holders |
|---|---|---|---|---|
| 1995 | 17,873 | 6,855 | 14,186 | 1,959 |
| 1996 | 17,209 | 7,479 | 14,339 | 2,248 |
| 1997 | 16,891 | 6,976 | 14,173 | 2,203 |
| 1998 | 16,567 | 6,986 | 14,610 | 2,455 |
| 1999 | 15,904 | 6,633 | 14,408 | 2,423 |
| 2000 | 15,304 | 6,856 | 14,643 | 2,810 |
| 2001 | 14,684 | 7,011 | 14,209 | 2,800 |
| 2002 | 13,779 | 6,765 | 13,957 | 2,977 |
| 2003 | 13,920 | 7,257 | 14,251 | 3,340 |
| 2004 | 13,770 | 7,913 | 14,270 | 3,715 |
| 2005 | 13,586 | 8,749 | 14,357 | 4,079 |
| 2006 | 14,266 | 9,398 | 14,762 | 4,800 |
| 2007 | 14,240 | 9,994 | 15,260 | 5,128 |
| 2008 | 14,774 | 9,984 | 16,069 | 5,277 |
| 2009 | 15,508 | 9,565 | 16,818 | 5,167 |
| 2010 | 15,276 | 8,768 | 16,328 | 4,868 |
| 2011 | 15,397 | 9,179 | 16,330 | 5,056 |
| 2012 | 16,073 | 9,556 | 16,910 | 5,224 |
| 2013 | 16,550 | 10,103 | 17,416 | 5,571 |
| 2014 | 16,663 | 10,207 | 17,347 | 5,633 |
| 2015 | 17,245 | 10,413 | 17,872 | 5,742 |
NOTE: Excludes respondents who did not report sex or citizenship.
- SOURCE: Doctorate Recipients from U.S. Universities 2015. Related detailed data: tables 20, 21.