
National Science Foundation Merit Review FY 1996
NSB-97-13 (Revised)
February 12, 1997
Memorandum to members of the National Science Board
Subject: FY 1996 Report on the NSF Merit Review System
The enclosed FY 1996 Report on the NSF Merit Review System is submitted in accordance with National Science Board policy endorsed in March, 1977, and amended in March, 1984, which requests that the Director provide to the Board an annual report on the Foundation's proposal review system.
I trust you will find the report informative.
Neal Lane
NSF Director
Highlights
- This report responds to a long-standing NSB policy requesting that the NSF Director submit an annual report on the NSF merit review system.
- During FY 1996, NSF conducted external competitive reviews of 29,953 proposals and funded 8,796 of them.
- The number of proposals reviewed annually by NSF has been stable at about 30,000 since 1992. The number of awards has declined by 13 percent during the same period.
- The NSF-wide funding rate was 29 percent in FY 1996, representing a steady decline from 34 percent five years ago. Directorate funding rates in FY 1996 ranged from 23 percent to 37 percent.
- Proposals from female and minority Principal Investigators (PIs) in FY 1996 were funded at about the same rate as the NSF average.
- Proposals from PIs who had received an NSF award in a previous fiscal year (prior PIs) were funded at a higher rate than proposals from new PIs (36 percent and 21 percent, respectively in FY 1996).
- The median award amount in FY 1996 was $52 K; the average was $85 K.
- The most frequent method of proposal review was a combination of mail and panel methods. Nearly sixty percent of proposals were reviewed in this manner in FY 1996, up from 42 percent in FY 1987.
- Proposals reviewed by a combination of mail and panel methods were reviewed by an average of 10.5 persons. Proposals reviewed by the panel-only method involved an average of 6.4 reviewers; the mail-only method involved an average of 4.5 reviewers.
- There were 53 requests for formal reconsideration of declinations during FY 1996; one program-level decision was reversed.
- NSB and NSF are developing new proposal review criteria to complement more closely the NSF strategic plan.
- The merit review system continues to be examined by internal staff and the external community for ways to improve its efficiency and effectiveness.
The FY 1996 Report on the NSF Merit Review System responds to a National Science Board (NSB) policy endorsed in 1977 and amended in 1984, requesting that the Director of the National Science Foundation (NSF) submit an annual report on the NSF proposal review system. This report provides summary information about levels of proposal and award activity and the process by which proposals are reviewed and awarded.
 On this page
A. Proposals, Awards, Funding Rates and Amounts
Award categories
During FY 1996, NSF, with the cooperation of external peer reviewers, competitively reviewed 29,953 research and education proposals. NSF funding was awarded to 8,796 of the proposals, producing a funding rate of 29 percent. The number of proposals reviewed annually by NSF has been reasonably stable at about 30,000 proposals since 1992. The number of awards however, has dropped by 13 percent, resulting in a declining funding rate as shown in Text Figure 1. Funding rates vary among directorates, ranging from 23 percent to 37 percent as shown in Appendix Table 1.
In addition to funding proposals that were competitively reviewed during FY 1996, NSF awarded 7,708 continuing grant increments (CGIs) based on proposals which had been competitively reviewed in earlier years. CGIs are funded in annual increments from current year appropriations. The CGI procedure complements the other major award instrument - standard grants - where all funds for a multiple year project are obligated out of a single year appropriation. NSF policy limits the amount of future year CGI commitments to 65 percent of a program's current fiscal year operating plan.
| Fiscal Year | 1992 | 1993 | 1994 | 1995 | 1996 |
| NSF Proposals | 30,018 | 29,893 | 30,122 | 30,413 | 29,953 |
| Awards | 10,059 | 9,041 | 9,694 | 9,286 | 8,796 |
| Funding Rate (%) | 34 | 30 | 32 | 31 | 29 |
| Fiscal Year | Five-year | Five-year | ||||||
| 1992 | 1993 | 1994 | 1995 | 1996 | Total | Average | ||
| NSF | Proposals | 30,018 | 29,893 | 30,122 | 30,413 | 29,953 | 150,399 | 30,080 |
| Awards | 10,059 | 9,041 | 9,694 | 9,286 | 8,796 | 46,876 | 9,375 | |
| Funding rate (%) | 34 | 30 | 32 | 31 | 29 | 31 | 31 | |
| BIO | Proposals | 5,157 | 4,872 | 4,771 | 5,256 | 5,682 | 25,738 | 5,148 |
| Awards | 1,403 | 1,329 | 1,407 | 1,385 | 1,333 | 6,857 | 1,371 | |
| Funding rate (%) | 27 | 27 | 29 | 26 | 23 | 27 | 27 | |
| CSE | Proposals | 2,175 | 2,195 | 1,917 | 2,062 | 1,927 | 10,276 | 2,055 |
| Awards | 780 | 680 | 705 | 717 | 643 | 3,525 | 705 | |
| Funding rate (%) | 36 | 31 | 37 | 35 | 33 | 34 | 34 | |
| EHR | Proposals | 5,276 | 5,012 | 4,663 | 4,751 | 3,502 | 23,204 | 4,641 |
| Awards | 1,451 | 1,267 | 1,404 | 1,247 | 1,098 | 6,467 | 1,293 | |
| Funding rate (%) | 28 | 25 | 30 | 26 | 31 | 28 | 28 | |
| ENG | Proposals | 5,114 | 6,280 | 6,421 | 5,731 | 5,946 | 29,492 | 5,898 |
| Awards | 1,450 | 1,403 | 1,519 | 1,462 | 1,373 | 7,207 | 1,441 | |
| Funding rate (%) | 28 | 22 | 24 | 26 | 23 | 24 | 24 | |
| GEO | Proposals | 3,238 | 3,206 | 3,641 | 3,421 | 3,704 | 17,210 | 3,442 |
| Awards | 1,404 | 1,257 | 1,300 | 1,203 | 1,144 | 6,308 | 1,262 | |
| Funding rate (%) | 43 | 39 | 36 | 35 | 31 | 37 | 37 | |
| MPS | Proposals | 5,167 | 4,709 | 5,011 | 5,211 | 4,974 | 25,072 | 5,014 |
| Awards | 2,104 | 1,778 | 1,991 | 1,873 | 1,834 | 9,580 | 1,916 | |
| Funding rate (%) | 41 | 38 | 40 | 36 | 37 | 38 | 38 | |
| SBE | Proposals | 3,434 | 3,166 | 3,100 | 3,479 | 3,446 | 16,625 | 3,325 |
| Awards | 1,256 | 1,101 | 1,085 | 1,140 | 1,130 | 5,712 | 1,142 | |
| Funding rate (%) | 37 | 35 | 35 | 33 | 33 | 34 | 34 | |
| Other | Proposals | 457 | 453 | 598 | 502 | 772 | 2,782 | 556 |
| Awards | 211 | 226 | 283 | 259 | 241 | 1,220 | 244 | |
| Funding rate (%) | 46 | 50 | 47 | 52 | 31 | 44 | 44 | |
Notes:
- "Competitively reviewed" proposals and awards refer to proposal actions for research, education and training which are processed through NSF's external merit review system each year.
- These figures do not include 7,708 second-year and later incremental awards during FY 1996 for "continuing grants" which are competitively reviewed in the first year of the award.
- Also excluded are 2,739 supplements and 689 contracts which are not subject to external merit review.
- "Other" organizational units include Office of Polar Programs and Office of Science and Technology Infrastructure.
Source: NSF Executive Information System, as of December 10, 1996.
Characteristics of Principal Investigators
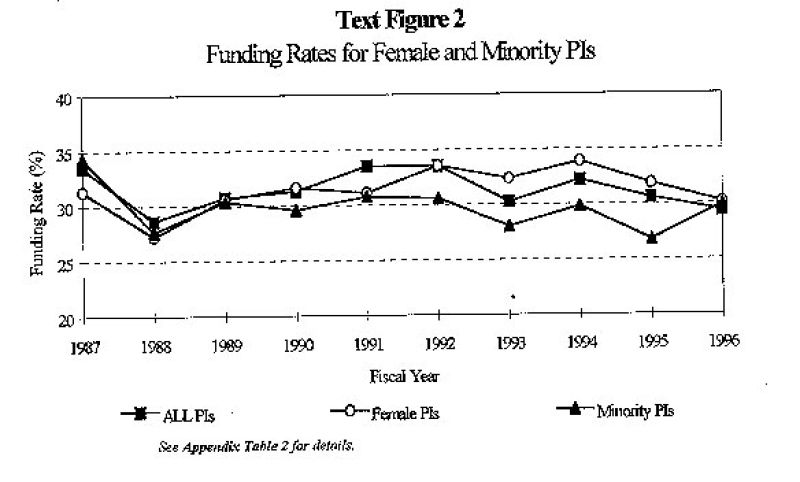
The number of proposals received from female and minority Principal Investigators (PIs) has increased slowly since 1990. Proposals, awards, funding rates and trends by PI characteristics are shown in Appendix Table 2. During FY 1996, about 17 percent of competitively reviewed proposals were from female PIs. Funding rates of proposals from female PIs have been higher than proposals from male PIs for five of the past seven years. Funding rate trends for female and minority PIs are graphed in Text Figure 2.
Five percent of competitively reviewed proposals during FY 1996 were from minority PIs. The funding rate for proposals from minority PIs were below the NSF rate from FY 1990 through FY 1995, but exceeded the NSF rate in FY 1996.
Forty-five percent of competitively reviewed proposals in FY 1996 were from PIs who had not received an NSF award in a previous fiscal year (new PIs); down from fifty-one percent in FY 1990. The funding rate for proposals from PIs who had received an NSF award (prior PIs) was higher than proposals from new PIs (36 percent and 21 percent, respectively in FY 1996). The difference in funding rates between proposals from new and prior PIs has been declining since 1991.
| Fiscal Year | ||||||||
| 1990 | 1991 | 1992 | 1993 | 1994 | 1995 | 1996 | ||
| All PIs | Proposals | 28,614 | 28,597 | 30,018 | 29,893 | 30,122 | 30,413 | 29,953 |
| Awards | 8,952 | 9,586 | 10,059 | 9,041 | 9,694 | 9,286 | 8,796 | |
| Funding Rate (%) | 31 | 34 | 34 | 30 | 32 | 31 | 29 | |
| Female PIs | Proposals | 3,848 | 4,545 | 4,393 | 4,411 | 4,803 | 4,893 | 4,976 |
| Awards | 1,216 | 1,414 | 1,473 | 1,426 | 1,626 | 1,559 | 1,500 | |
| Funding Rate (%) | 32 | 31 | 34 | 32 | 34 | 32 | 30 | |
| Male PIs | Proposals | 24,589 | 23,890 | 25,279 | 25,071 | 24,960 | 25,121 | 24,574 |
| Awards | 7,657 | 8,089 | 8,461 | 7,497 | 7,957 | 7,597 | 7,185 | |
| Funding Rate (%) | 31 | 34 | 33 | 30 | 32 | 30 | 29 | |
| Minority PIs | Proposals | 1,187 | 1,226 | 1,484 | 1,411 | 1,470 | 1,521 | 1,527 |
| Awards | 351 | 377 | 454 | 395 | 438 | 407 | 457 | |
| Funding Rate (%) | 30 | 31 | 31 | 28 | 30 | 27 | 30 | |
| New PIs | Proposals | 14,725 | 14,543 | 14,851 | 14,358 | 14,399 | 14,030 | 13,483 |
| Awards | 3,243 | 3,449 | 3,567 | 3,066 | 3,400 | 3,164 | 2,824 | |
| Funding Rate (%) | 22 | 24 | 24 | 21 | 24 | 23 | 21 | |
| Prior PIs | Proposals | 13,889 | 14,054 | 15,167 | 15,534 | 15,723 | 16,383 | 16,468 |
| Awards | 5,709 | 6,137 | 6,492 | 5,975 | 6,294 | 6,122 | 5,972 | |
| Funding Rate (%) | 41 | 44 | 43 | 38 | 40 | 37 | 36 | |
Notes:
- "Competitively reviewed" proposals and awards refer to proposal actions for research, education and training which are processed through NSF's external merit review system each year.
- "Gender" is based on self-reported information from the PIs most recent proposal.
- "Minority" is based on the PIs ethnic/racial status as reported to NSF on the most recent proposal. Includes American Indian, Alaskan Native, Black, Hispanic, and Pacific Islander and excludes Asian and White-Not of Hispanic Origin. PIs can decline to report their ethnic/racial status.
- "New PI" refers to proposals from PIs who had not received an NSF award in a previous fiscal year.
- "Prior PI" refers to proposals from PIs who had received an NSF award in a previous fiscal year.
Source: All data are from the NSF Executive Information System.
- Data on all PIs, female PIs, male PIs, and minority PIs are as of December 10, 1996.
- Data on new PIs and prior PIs are as of February 10, 1997.
Award amounts
The median annual award amount (adjusted for multiple year projects) among competitive awards made during FY 1996 was $52,313. The average award amount among the same set of awards was $85,385. The difference between the median and average award amounts is due to a combination of numerous small awards pulling the median down, and large awards for centers and facilities pulling the average up. Award amounts have been consistent over the past decade, when adjusted to constant dollars as measured by the Consumer Price Index. There are considerable variations among directorates as shown in Appendix Table 3.
| Median | Average | |
| NSF | $52,313 | $85,385 |
| BIO | $64,217 | $75,390 |
| CSE | $54,468 | $91,574 |
| EHR | $25,047 | $92,774 |
| ENG | $75,061 | $89,107 |
| GEO | $60,000 | $93,163 |
| MPS | $52,500 | $96,268 |
| SBE | $20,000 | $44,565 |
Note: Median and average are based on all awards competitively reviewed during FY 1996.
Source: NSF Executive Information System, as of December 10, 1996.
B. Methods of proposal review
Peer Review and Merit Review
There is a tendency to use the terms "peer review" and "merit review" interchangeably. It is more accurate to refer to the NSF proposal review process as "merit review with peer evaluation." The involvement of knowledgeable peers from outside the Foundation in the review of proposals is the keystone of NSF's proposal review system. Their judgments of the extent to which proposals address established criteria are vital for informing NSF staff and influencing funding recommendations. However, development of a portfolio of program awards that address all of NSF's diverse objectives requires a broader perspective than can be achieved solely on the basis of a set of independent or panel-generated proposal reviews. Therefore, NSF relies on the judgment of qualified program officers to make funding recommendations which, on the whole, produce a portfolio of awards addressing NSF's strategic goals and related factors such as:
- Contributions to human resource and institutional infrastructure development,
- Support for "risky" proposals with potential for significant advances in a field,
- Encouragement of interdisciplinary activities, and
- Achievement of program-level objectives and initiatives.
Each program officer funding recommendation is subject to a programmatic review by a higher level reviewing official (usually the division director), and an administrative review by a grants officer. Awards in excess of a $3 million commitment during a project year, or $15 million over five years, require approval by the National Science Board.
Mail-only, Panel-only and Mail-plus-Panel
NSF programs obtain external peer review by two principal methods, mail and panel. In addition to mail and panel reviews, site visits by NSF staff and external peers are often used to review large facility and center proposals. NSF program officers are given discretion in the specific use of review methods, subject to supervisory approval.
In mail reviews, peers are sent proposals and asked to submit written comments to NSF by postal mail, electronic mail, or facsimile. These mail reviews may either be used by the NSF program officer directly to support a funding recommendation ("mail-only" review), or presented to a panel to inform discussion of the proposal.
Many programs use a combination of mail and panel methods to obtain peer reviews. Major variations of such mail-plus-panel reviews are:
- A peer is asked to submit a written mail review and also serve as a panelist, in effect contributing two reviews for each proposal;
- A peer is asked to submit only a mail review which is considered at a later panel meeting; and
- A peer is asked to participate only as a panelist without submitting a written review prior to the meeting.
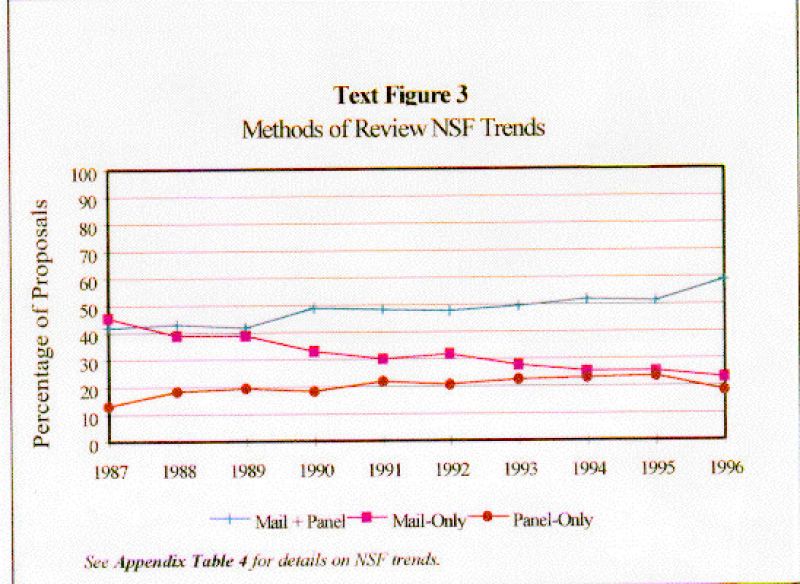
The mail-plus-panel method was used for 59 percent of proposals reviewed during FY 1996; 23 percent of proposals were reviewed by mail-only, and 18 percent by panel-only. The percentage of NSF proposals reviewed by mail-plus-panel has increased during the past decade, with a corresponding drop in the percentage of proposals reviewed by mail-only. These trends are shown in Text Figure 3. [See Appendix Table 4 for details on NSF trends.]
Directorates vary widely in their use of proposal review methods as summarized in Text Figure 4, and detailed in Appendix Table 5.
| Total | Mail + Panel | Mail-Only | Panel-Only | ||||
| FY | Proposals | Proposals | Percent | Proposals | Percent | Proposals | Percent |
| 1987 | 22,284 | 9,269 | 42 | 10,147 | 46 | 2,868 | 13 |
| 1988 | 27,020 | 11,619 | 43 | 10,433 | 39 | 4,968 | 18 |
| 1989 | 27,165 | 11,416 | 42 | 10,506 | 39 | 5,243 | 19 |
| 1990 | 28,178 | 13,784 | 49 | 9,290 | 33 | 5,104 | 18 |
| 1991 | 28,080 | 13,600 | 48 | 8,441 | 30 | 6,039 | 22 |
| 1992 | 29,184 | 13,980 | 48 | 9,216 | 32 | 5,988 | 21 |
| 1993 | 29,128 | 14,445 | 50 | 8,121 | 28 | 6,562 | 23 |
| 1994 | 29,908 | 15,397 | 51 | 7,615 | 25 | 6,896 | 23 |
| 1995 | 30,138 | 15,430 | 51 | 7,581 | 25 | 7,127 | 24 |
| 1996 | 29,630 | 17,477 | 59 | 6,726 | 23 | 5,427 | 18 |
Note: Number of proposals differs slightly from previous tables due to coding variations.
Source: Executive Information System, as of December 2, 1996.
| Directorate | Primary Methods of Review |
|---|---|
| BIO, GEO and SBE | Mail-Plus-Panel |
| EHR | Panel |
| MPS | |
| CSE and ENG | Broad mix of methods |
| Total | Mail + Panel | Mail-Only | Panel-Only | ||||
| Directorate | Proposals | Proposals | Percent | Proposals | Percent | Proposals | Percent |
| NSF | 29,630 | 17,477 | 59 | 6,726 | 23 | 5,427 | 18 |
| BIO | 5,701 | 5,132 | 90 | 266 | 5 | 303 | 5 |
| CSE | 1,886 | 930 | 49 | 603 | 32 | 353 | 19 |
| EHR | 3,701 | 916 | 25 | 285 | 8 | 2,500 | 68 |
| ENG | 5,771 | 3,362 | 58 | 1,195 | 21 | 1,214 | 21 |
| GEO | 3,637 | 2,704 | 74 | 791 | 22 | 142 | 4 |
| MPS | 4,857 | 1,605 | 33 | 2,615 | 54 | 637 | 13 |
| SBE | 3,323 | 2,263 | 68 | 836 | 25 | 224 | 7 |
| Other | 754 | 565 | 75 | 135 | 18 | 54 | 7 |
Note: "Other" includes the Office of Polar Programs and the Office of Science and Technology Infrastructure.
Source: NSF Executive Information System, as of December 2, 1996.
| Number of Proposals (RevMeth) | Prop & Awd | P&A TOT- | |||||
| Directorate | Year | Mail-only | Panel-only | Both | TOTAL | TOTAL | RevM TOT |
| NSF | 1996 | 6,726 | 5,427 | 17,477 | 29,630 | 29,953 | 323 |
| 1995 | 7,581 | 7,128 | 15,431 | 30,140 | 30,413 | 273 | |
| Diff 96-95 | -855 | -1,701 | 2,046 | -510 | -460 | ||
| BIO | 1996 | 266 | 303 | 5,132 | 5,701 | 5,682 | -19 |
| 1995 | 327 | 37 | 4,900 | 5,264 | 5,256 | -8 | |
| Diff 96-95 | -61 | 266 | 232 | 437 | 426 | ||
| CSE | 1996 | 603 | 353 | 930 | 1,886 | 1,927 | 41 |
| 1995 | 763 | 482 | 807 | 2,052 | 2,062 | 10 | |
| Diff 96-95 | -160 | -129 | 123 | -166 | -135 | ||
| EHR | 1996 | 285 | 2,500 | 916 | 3,701 | 3,502 | -199 |
| 1995 | 363 | 3,138 | 1,450 | 4,951 | 4,751 | -200 | |
| Diff 96-95 | -78 | -638 | -534 | -1,250 | -1,249 | ||
| ENG | 1996 | 1,195 | 1,214 | 3,362 | 5,771 | 5,946 | 175 |
| 1995 | 1,179 | 2,711 | 1,663 | 5,553 | 5,731 | 178 | |
| Diff 96-95 | 16 | -1,497 | 1,699 | 218 | 215 | ||
| GEO | 1996 | 791 | 142 | 2,704 | 3,637 | 3,704 | 67 |
| 1995 | 810 | 84 | 2,514 | 3,408 | 3,421 | 13 | |
| Diff 96-95 | -19 | 58 | 190 | 229 | 283 | ||
| MPS | 1996 | 2,615 | 637 | 1,605 | 4,857 | 4,974 | 117 |
| 1995 | 3,326 | 517 | 1,254 | 5,097 | 5,211 | 114 | |
| Diff 96-95 | -711 | 120 | 351 | -240 | -237 | ||
| SBE | 1996 | 836 | 224 | 2,263 | 3,323 | 3,446 | 123 |
| 1995 | 706 | 123 | 2,506 | 3,335 | 3,479 | 144 | |
| Diff 96-95 | 130 | 101 | -243 | -12 | -33 | ||
| O/D | 1996 | 135 | 54 | 565 | 754 | 772 | 18 |
| 1995 | 107 | 36 | 337 | 480 | 502 | 22 | |
| Diff 96-95 | 28 | 18 | 228 | 274 | 270 | ||
Method of Review | ||||
| Directorate | Mail Only | Panel Only | Both Mail & Panel | Total Proposals Reviewed |
| NSF | 7,581 | 7,128 | 15,431 | 30,140 |
| BIO | 327 | 37 | 4,900 | 5,264 |
| CSE | 763 | 482 | 807 | 2,052 |
| EHR | 363 | 3,138 | 1,450 | 4,951 |
| ENG | 1,179 | 2,711 | 1,663 | 5,553 |
| GEO | 810 | 84 | 2,514 | 3,408 |
| MPS | 3,326 | 517 | 1,254 | 5,097 |
| SBE | 706 | 123 | 2,506 | 3,335 |
| Other | 107 | 36 | 337 | 480 |
Source: NSF Executive Information System as of June 24, 1996.
Reviewers
Diversity of the reviewer pool is an important feature of the NSF merit review system. Reviewers from diverse backgrounds help ensure that a wide range of perspectives are taken into consideration in the process of funding research and education proposals. NSF emphasizes reviewer diversity through a variety of processes, including a large and expanding Foundation-wide reviewer database, explicit policy guidance, mandatory training for all program officers, and directorate-level initiatives. NSF maintains a central electronic database of over 220,000 reviewers from which over 50,000 reviewers are selected annually. This database is continuously being updated; over 40,000 new potential reviewers have been added since 1992. Potential reviewers are identified from a variety of sources including applicant suggestions, references attached to proposals and published papers, and input from visiting scientists.
NSF policy states that each program funding recommendation must be accompanied by at least three external reviews (exceptions are described in Section F below). On average, proposals during FY 1996 were considered by 8.4 reviewers. The average number of reviews for proposals reviewed by mail-only, panel-only, and mail-plus-panels (shown below in text figure 5). There is considerable variation among directorates (shown below in appendix table 6).
Participation in the peer review process is voluntarily. Panelists are reimbursed for expenses; mail reviewers receive no financial compensation. Nevertheless, seventy percent (70%) of mail-only requests in FY 1996 produced reviews. This rate has been steady since 1990.
Methods of Review | ||||
| All Methods | Mail + Panel | Mail-Only | Panel-Only | |
| NSF reviews | 247,877 | 182,726 | 30,154 | 34,997 |
| Proposals | 29,630 | 17,477 | 6,726 | 5,427 |
| Rev/prop | 8.4 | 10.5 | 4.5 | 6.4 |
Methods of Review | |||||
| Directorate | All Methods | Mail + Panel | Mail-Only | Panel-Only | |
| NSF | Reviews | 247,877 | 182,726 | 30,154 | 34,997 |
| Proposals | 29,630 | 17,477 | 6,726 | 5,427 | |
| Rev/Prop | 8.4 | 10.5 | 4.5 | 6.4 | |
| BIO | Reviews | 85,903 | 80,199 | 1,224 | 4,480 |
| Proposals | 5,701 | 5,132 | 266 | 303 | |
| Rev/Prop | 15.1 | 15.6 | 4.6 | 14.8 | |
| CSE | Reviews | 8,079 | 4,267 | 2,346 | 1,466 |
| Proposals | 1,886 | 930 | 603 | 353 | |
| Rev/Prop | 4.3 | 4.6 | 3.9 | 4.2 | |
| EHR | Reviews | 23,198 | 7,953 | 1,422 | 13,823 |
| Proposals | 3,701 | 916 | 285 | 2,500 | |
| Rev/Prop | 6.3 | 8.7 | 5.0 | 5.5 | |
| ENG | Reviews | 22,690 | 12,871 | 5,045 | 4,774 |
| Proposals | 5,771 | 3,362 | 1,195 | 1,214 | |
| Rev/Prop | 3.9 | 3.8 | 4.2 | 3.9 | |
| GEO | Reviews | 36,698 | 31,601 | 3,992 | 1,105 |
| Proposals | 3,637 | 2,704 | 791 | 142 | |
| Rev/Prop | 10.1 | 11.7 | 5.0 | 7.8 | |
| MPS | Reviews | 34,996 | 15,679 | 12,348 | 6,969 |
| Proposals | 4,857 | 1,605 | 2,615 | 637 | |
| Rev/Prop | 7.2 | 9.8 | 4.7 | 10.9 | |
| SBE | Reviews | 31,027 | 25,927 | 3,171 | 1,929 |
| Proposals | 3,323 | 2,263 | 836 | 224 | |
| Rev/Prop | 9.3 | 11.5 | 3.8 | 8.6 | |
| Other | Reviews | 5,286 | 4,229 | 606 | 451 |
| Proposals | 754 | 565 | 135 | 54 | |
| Rev/Prop | 7.0 | 7.5 | 4.5 | 8.4 | |
Note:
-- Peers participating as both a mail and panel reviewer for the same proposal
-- "Other" includes the Office of Polar Programs and the Office of Science
Source: NSF Executive Information System as of December 2, 1996.
Reviewer Proposal Ratings
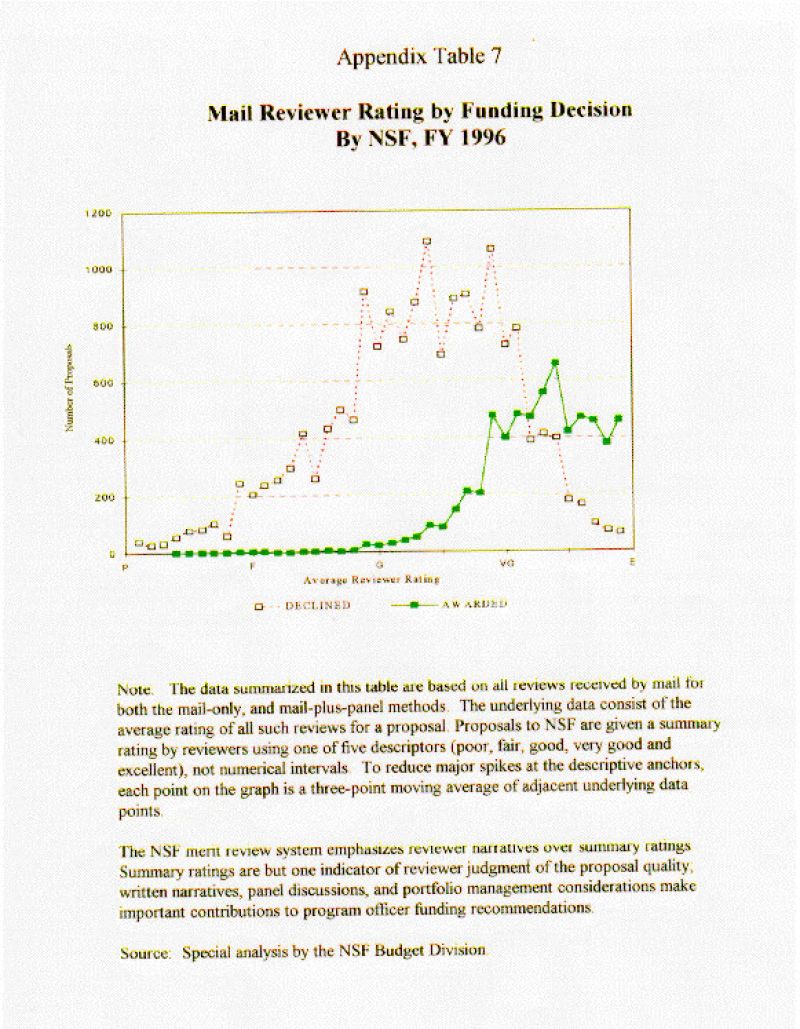
The NSF merit review system emphasizes reviewer narratives over summary ratings. Summary ratings are but one indicator of reviewer judgment of the proposal quality; written narratives, panel discussions, and portfolio management considerations make important contributions to program officer funding recommendations. The distribution of average summary ratings of mail reviews for awarded and declined proposals is provided in Appendix Table 7.
C. Requests for Reconsideration of Declined Proposals
Every proposer receives a description of the context in which the proposal was reviewed from the NSF program officer, along with a copy of each review considered in making the funding decision. A declined PI may ask for additional clarification of the decision. If the PI is not satisfied that the proposal was fairly handled and reasonably reviewed a formal reconsideration may be requested from the cognizant Assistant Director (AD). If the AD upholds the original action, the applicant's institution may request a second reconsideration from the Foundation's Deputy Director (O/DD). The objective of the reconsideration process is to ensure that NSF's review has been fair and reasonable, both substantively and procedurally.
On average, NSF annually declines over 20,000 proposals but receives only 35 requests for formal reconsideration. Most program-level decisions are upheld in the reconsideration process. The number of requests for formal reconsideration and resulting decisions at both the AD and O/DD levels from FY 1992 through FY 1996 are displayed in appendix table 8 below.
| Level of Review | Fiscal Year | Five-year | Five-year | |||||
| Requests & Decisions | 1992 | 1993 | 1994 | 1995 | 1996 | Total | Average | |
| First Level Reviews (by Assistant Directors): | ||||||||
| NSF | Requests | 35 | 27 | 28 | 38 | 46 | 174 | 35 |
| > Upheld | 33 | 26 | 30 | 37 | 45 | 171 | 34 | |
| > Reversed | 3 | 1 | 0 | 1 | 1 | 6 | 1 | |
| BIO | Requests | 1 | 2 | 5 | 4 | 3 | 15 | 3 |
| > Upheld | 1 | 2 | 5 | 4 | 3 | 15 | 3 | |
| > Reversed | 0 | 0 | 0 | 0 | 0 | 0 | 0 | |
| CSE | Requests | 3 | 1 | 0 | 3 | 1 | 8 | 2 |
| > Upheld | 2 | 1 | 0 | 3 | 1 | 7 | 1 | |
| > Reversed | 1 | 0 | 0 | 0 | 0 | 1 | 0 | |
| EHR | Requests | 0 | 6 | 4 | 3 | 8 | 21 | 4 |
| > Upheld | 0 | 4 | 6 | 3 | 8 | 21 | 4 | |
| > Reversed | 0 | 0 | 0 | 0 | 0 | 0 | 0 | |
| ENG | Requests | 7 | 3 | 6 | 3 | 5 | 24 | 5 |
| > Upheld | 7 | 3 | 6 | 3 | 5 | 24 | 5 | |
| > Reversed | 0 | 0 | 0 | 0 | 0 | 0 | 0 | |
| GEO | Requests | 4 | 5 | 5 | 5 | 4 | 23 | 5 |
| > Upheld | 4 | 5 | 5 | 5 | 4 | 23 | 5 | |
| > Reversed | 0 | 0 | 0 | 0 | 0 | 0 | 0 | |
| MPS | Requests | 15 | 9 | 8 | 18 | 20 | 70 | 14 |
| > Upheld | 15 | 10 | 8 | 17 | 19 | 69 | 14 | |
| > Reversed | 1 | 1 | 0 | 1 | 1 | 4 | 1 | |
| SBE | Requests | 5 | 1 | 0 | 2 | 1 | 9 | 2 |
| > Upheld | 4 | 1 | 0 | 2 | 1 | 8 | 2 | |
| > Reversed | 1 | 0 | 0 | 0 | 0 | 1 | 0 | |
| OPP | Requests | 0 | 0 | 0 | 0 | 4 | 4 | 1 |
| > Upheld | 0 | 0 | 0 | 0 | 4 | 4 | 1 | |
| > Reversed | 0 | 0 | 0 | 0 | 0 | 0 | 0 | |
| Second Level Reviews (by Deputy Director): | ||||||||
| O/DD | Requests | 6 | 10 | 8 | 11 | 7 | 42 | 8 |
| > Upheld | 6 | 8 | 9 | 10 | 7 | 40 | 8 | |
| > Reversed | 0 | 1 | 0 | 0 | 0 | 1 | 0 | |
Note: The number of decisions (upheld or reversed) may not equal the number of requests
in each year due to carryover of pending reconsideration requests from a previous year.
D. Small Grants for Exploratory Research (SGER)
Since the beginning of FY 1990, the Small Grants for Exploratory Research (SGER) option has permitted program officers throughout the Foundation to make short-term (one to two years), small-scale (less than $50 K) grants without formal external review. Characteristics of activities which can be supported by an SGER award include:
- Preliminary work on untested and novel ideas;
- Application of new approaches to "old" topics;
- Ventures into emerging research areas; and,
- Narrow windows of opportunity for data collection, such as natural disasters and infrequent phenomena.
NSF received 220 SGER proposals in FY 1996 and made 164 awards; a funding rate of 75 percent. The SGER funding rate is much higher than for regular, competitively reviewed proposals in large part because potential SGER applicants are encouraged to contact an NSF program officer before submitting an SGER proposal to determine its appropriateness for the SGER funding option. As potential SGER applicants have become familiar with this practice, the SGER funding rate has increased from 55 percent in the first year to 75 percent in FY 1996, as shown in text figure 7. See appendix table 9 for SGER proposal and award trends by directorate.
Program officers may commit up to five percent of their operating budget to SGER awards, but the NSF-wide average is less than one percent. The average SGER award amount in FY 1996 was $33,869, well under the maximum authorized SGER award amount of $50,000. The average award amount has been relatively stable over the seven-year existence of the SGER funding option. SGER funding trends by directorate are provided in appendix table 10.
Fiscal Year | |||||||
| 1990 | 1991 | 1992 | 1993 | 1994 | 1995 | 1996 | |
| NSF Proposals | 475 | 341 | 320 | 336 | 276 | 246 | 220 |
| Awards | 261 | 207 | 214 | 240 | 203 | 186 | 164 |
| Funding Rate | 55% | 61% | 67% | 71% | 74% | 76% | 75% |
See appendix table 9 for SGER proposal and award trends by directorate.
| Fiscal Year | Seven-year | |||||||||
| 1990 | 1991 | 1992 | 1993 | 1994 | 1995 | 1996 | Total | Average | ||
| NSF | Proposals | 475 | 345 | 337 | 344 | 286 | 252 | 233 | 2,272 | 325 |
| Awards | 261 | 209 | 224 | 244 | 209 | 189 | 170 | 1,506 | 215 | |
| Funding Rate | 55% | 61% | 66% | 71% | 73% | 75% | 73% | 66% | 66% | |
| BIO | Proposals | 133 | 82 | 84 | 87 | 70 | 63 | 58 | 577 | 82 |
| Awards | 67 | 48 | 42 | 64 | 46 | 47 | 41 | 355 | 51 | |
| Funding Rate | 50% | 59% | 50% | 74% | 66% | 75% | 71% | 62% | 62% | |
| CSE | Proposals | 22 | 15 | 17 | 15 | 11 | 19 | 23 | 122 | 17 |
| Awards | 12 | 8 | 12 | 11 | 9 | 19 | 20 | 91 | 13 | |
| Funding Rate | 55% | 53% | 71% | 73% | 82% | 100% | 87% | 75% | 75% | |
| EHR | Proposals | 11 | 8 | 18 | 8 | 10 | 6 | 13 | 74 | 11 |
| Awards | 10 | 5 | 11 | 4 | 6 | 3 | 6 | 45 | 6 | |
| Funding Rate | 91% | 63% | 61% | 50% | 60% | 50% | 46% | 61% | 61% | |
| ENG | Proposals | 125 | 118 | 100 | 110 | 90 | 71 | 62 | 676 | 97 |
| Awards | 87 | 74 | 78 | 83 | 68 | 58 | 48 | 496 | 71 | |
| Funding Rate | 70% | 63% | 78% | 75% | 76% | 82% | 77% | 73% | 73% | |
| GEO | Proposals | 41 | 40 | 46 | 42 | 38 | 29 | 27 | 263 | 38 |
| Awards | 29 | 32 | 39 | 38 | 35 | 23 | 23 | 219 | 31 | |
| Funding Rate | 71% | 80% | 85% | 90% | 92% | 79% | 85% | 83% | 83% | |
| MPS | Proposals | 110 | 69 | 47 | 45 | 44 | 37 | 29 | 381 | 54 |
| Awards | 35 | 31 | 22 | 18 | 27 | 18 | 14 | 165 | 24 | |
| Funding Rate | 32% | 45% | 47% | 40% | 61% | 49% | 48% | 43% | 43% | |
| SBE | Proposals | 29 | 9 | 23 | 28 | 12 | 16 | 15 | 132 | 19 |
| Awards | 17 | 7 | 18 | 17 | 8 | 10 | 12 | 89 | 13 | |
| Funding Rate | 59% | 78% | 78% | 61% | 67% | 63% | 80% | 67% | 67% | |
| OPP | Proposals | 4 | 4 | 2 | 9 | 11 | 11 | 6 | 47 | 7 |
| Awards | 4 | 4 | 2 | 9 | 10 | 11 | 6 | 46 | 7 | |
| Funding Rate | 100% | 100% | 100% | 100% | 91% | 100% | 100% | 98% | 98% | |
Source: All data in this table are from a special analysis by NSF's Budget Division, except EHR SGER proposals and awards from 1991 through 1996 which are based on EHR records.
| Fiscal Year | Seven-year | ||||||||
| 1990 | 1991 | 1992 | 1993 | 1994 | 1995 | 1996 | Total | ||
| NSF | Total $ | $8,269,164 | $6,262,297 | $6,717,128 | $7,387,917 | $7,176,628 | $6,230,400 | $5,554,573 | $47,180,145 |
| Awards | 261 | 209 | 224 | 244 | 209 | 189 | 170 | 1,506 | |
| Average $ | $31,683 | $29,963 | $29,987 | $30,278 | $34,338 | $32,965 | $32,674 | $31,328 | |
| BIO | Total $ | $2,334,609 | $1,371,991 | $1,574,372 | $2,029,282 | $1,651,130 | $1,470,936 | $1,097,173 | $11,529,493 |
| Awards | 67 | 48 | 42 | 64 | 46 | 47 | 41 | 355 | |
| Average $ | $34,845 | $28,583 | $37,485 | $31,708 | $35,894 | $31,297 | $26,760 | $32,477 | |
| CSE | Total $ | $436,758 | $314,418 | $351,371 | $430,158 | $371,253 | $990,148 | $905,480 | $3,799,586 |
| Awards | 12 | 8 | 12 | 11 | 9 | 19 | 20 | 91 | |
| Average $ | $36,397 | $39,302 | $29,281 | $39,105 | $41,250 | $52,113 | $45,274 | $41,754 | |
| EHR | Total $ | $417,962 | n.a. | n.a. | n.a. | n.a. | n.a. | n.a. | n.a. |
| Awards | 10 | 5 | 11 | 4 | 6 | 3 | 6 | 45 | |
| Average $ | $41,796 | n.a. | n.a. | n.a. | n.a. | n.a. | n.a. | n.a. | |
| ENG | Total $ | $2,673,484 | $2,408,519 | $2,375,188 | $2,301,002 | $2,168,049 | $2,014,205 | $1,751,818 | $15,692,265 |
| Awards | 87 | 74 | 78 | 83 | 68 | 58 | 48 | 496 | |
| Average $ | $30,730 | $32,548 | $30,451 | $27,723 | $31,883 | $34,728 | $36,496 | $31,638 | |
| GEO | Total $ | $927,637 | $944,274 | $1,332,609 | $1,199,995 | $1,249,897 | $749,991 | $690,827 | $7,095,230 |
| Awards | 29 | 32 | 39 | 38 | 35 | 23 | 23 | 219 | |
| Average $ | $31,987 | $29,509 | $34,169 | $31,579 | $35,711 | $32,608 | $30,036 | $32,398 | |
| MPS | Total $ | $1,364,522 | $1,134,002 | $746,088 | $744,598 | $1,081,293 | $552,899 | $555,634 | $6,179,036 |
| Awards | 35 | 31 | 22 | 18 | 27 | 18 | 14 | 165 | |
| Average $ | $38,986 | $36,581 | $33,913 | $41,367 | $40,048 | $30,717 | $39,688 | $37,449 | |
| SBE | Total $ | $114,192 | $89,093 | $337,500 | $402,611 | $262,132 | $202,664 | $208,557 | $1,616,749 |
| Awards | 17 | 7 | 18 | 17 | 8 | 10 | 12 | 89 | |
| Average $ | $6,717 | $12,728 | $18,750 | $23,683 | $32,767 | $20,266 | $17,380 | $18,166 | |
| OPP | Total $ | n.a. | n.a. | n.a. | $280,271 | $392,874 | $249,557 | $345,084 | $1,267,786 |
| Awards | 4 | 4 | 2 | 9 | 10 | 11 | 6 | 46 | |
| Average $ | n.a. | n.a. | n.a. | $31,141 | $39,287 | $22,687 | $57,514 | $27,561 | |
Source: All data in this table are from a special analysis by NSF's Budget Division, except EHR SGER proposals and awards from 1991 through 1996 which are based on EHR records. NSF award amounts do not include EHR from 1991 through 1996, or OPP from 1990 through 1992.
E. Committee of Visitors (COV)
A Committee of Visitors (COV) is a panel of external experts convened to review the technical and managerial stewardship of a specific NSF program or cluster of programs. Each program that awards grants or cooperative agreements is reviewed on a three-year cycle. There are currently 178 such programs at NSF; 63 programs were reviewed during FY 1996. A list of all programs subject to review by a Committee of Visitors and the fiscal year of the most recent review is provided in Appendix Table 11.
Each COV must operate in accordance with the Federal Advisory Committee Act (FACA) of 1972. In compliance with FACA regulations, virtually all COVs are established as subcommittees of an existing chartered advisory committee, and the COV report is reviewed and approved by the parent advisory committee. The cognizant Assistant Director (AD) provides the parent advisory committee with a written response to each COV report. The COV's report and the AD's response are public documents; some have been publicized in the professional literature.
| Directorate | Fiscal Year of | ||
| Division | Most Recent | ||
| Program | COV | ||
| Biological Sciences | |||
| Biological Instrumentation & Resources | |||
| Instrumentation & Instrument Development | 1995 | ||
| Special Projects | 1995 | ||
| Environmental Biology | |||
| Ecological Studies | 1995 | ||
| Systematic & Population Biology | 1996 | ||
| Long-Term Projects in Environmental Biology | 1994 | ||
| Integrative Biology & Neuroscience | |||
| Neuroscience | 1995 | ||
| Developmental Mechanisms | 1996 | ||
| Physiology & Behavior | 1994 | ||
| Molecular & Cellular Biosciences | |||
| Genetics & Nucleic Acids | 1995 | ||
| Biochem & Molecular Structure & Function | 1996 | ||
| Cell Biology | 1994 | ||
| Computer and Information Science and Engineering | |||
| Advanced Scientific Computing | |||
| New Technologies | 1995 | ||
| Supercomputer Centers | 1994 | ||
| Computer & Computation Research | |||
| Theory of Computing | 1996 | ||
| Computer Systems | 1996 | ||
| Numeric, Symbolic & Geometric Computation | 1996 | ||
| Software Engineering | 1996 | ||
| System Software | 1996 | ||
| Cross-Disciplinary Activities | |||
| CISE Instrumentation | 1994 | ||
| Institutional Infrastructure | 1996 | ||
| Information, Robotics and Intelligent Systems | |||
| Information Technology & Organizations | 1995 | ||
| Interactive Systems | 1995 | ||
| Knowledge & Database Systems | 1995 | ||
| Robotics & Machine Intelligence | 1995 | ||
| Microelectronic Information Processing Systems | |||
| Circuits & Signal Processing | 1995 | ||
| Design, Tools & Test | 1995 | ||
| Experimental Systems | 1996 | ||
| Microelectronic Systems Architecture | 1996 | ||
| Systems Prototyping & Fabrication | 1996 | ||
| Networking & Communications Research & Infrastructure | |||
| NSFNET | 1996 | ||
| Networking & Communications Research | 1994 | ||
| Education and Human Resources | |||
| Education Systemic Reform | |||
| Statewide Systemic Initiatives | 1994 | ||
| Urban Systemic Initiatives | 1996 | ||
| Rural Systemic Initiatives | New | ||
| EPSCoR | 1996 | ||
| Elementary, Secondary & Informal Education | |||
| Informal Science Education | 1995 | ||
| Teacher Enhancement | 1996 | ||
| Young Scholars | 1994 | ||
| Instructional Materials Development | 1994 | ||
| Undergraduate Education | |||
| Course & Curriculum | 1994 | ||
| Instrumentation & Laboratory Improvement | 1994 | ||
| Faculty Enhancement | 1994 | ||
| Teacher Preparation | 1994 | ||
| Advanced Technological Education | New | ||
| Graduate Education & Research Development | |||
| Graduate Research Fellowships | 1995 | ||
| Graduate Research Traineeships | New | ||
| NATO Postdoctorate Fellowships | 1996 | ||
| Human Resource Development | |||
| Partnerships for Minority Student Achievement | 1995 | ||
| Summer Science Camps | 1995 | ||
| Alliances for Minority Participation | 1995 | ||
| Research Careers Minority Scholars | 1995 | ||
| Centers of Excellence for Science, Math, and Technology | 1994 | ||
| Programs for Women & Girls | New | ||
| Programs for Persons with Disabilities | New | ||
| Research, Evaluation & Communication | |||
| Research in Teaching & Learning | 1995 | ||
| Applications of Advanced Technologies | 1996 | ||
| Studies and Indicators | 1996 | ||
| Evaluation | 1994 | ||
| Engineering | |||
| Bioengineering & Environmental Systems | |||
| Bioengineering & Aid to Persons w/ Disabilities | 1996 | ||
| Environmental & Ocean Systems | 1996 | ||
| Civil & Mechanical Structures | |||
| Dynamic Systems & Control | 1995 | ||
| Structures, Geomechanics & Building Systems | 1995 | ||
| Surface Engineering &Tribology | 1995 | ||
| Mechanics & Materials | 1995 | ||
| Earthquake Hazard Mitigation | 1996 | ||
| Natural & Technological Hazard Mitigation | 1996 | ||
| Chemical & Transport Systems | |||
| Chemical Reaction Processes | 1994 | ||
| Interfacial, Transport & Separation Processes | 1995 | ||
| Fluid, Particulate & Hydraulic Systems | 1994 | ||
| Thermal Systems | 1996 | ||
| Design, Manufacture & Industrial Innovation | |||
| Operations Research & Production Systems | 1996 | ||
| Design & Computer-Integrated Engineering | 1994 | ||
| Manufacturing Processes & Equipment | 1995 | ||
| Small Business Innovation Research | 1995 | ||
| Management of Technological Innovation | 1996 | ||
| Special Studies & Assessments | 1996 | ||
| Industry/ University Cooperative Projects | 1996 | ||
| Electrical & Communications Systems | |||
| Quantum Electronics, Waves & Beams | 1996 | ||
| Solid State & Microstructures | 1996 | ||
| Communications & Computational Systems | 1996 | ||
| Engineering Systems | 1996 | ||
| Engineering, Education & Centers | |||
| Engineering Education | 1995 | ||
| Human Resource Development | 1995 | ||
| Engineering Research Centers | 1995 | ||
| Industry/Univ Cooperative Research Centers | 1994 | ||
| Geosciences | |||
| Atmospheric Sciences | |||
| -- Lower Atmospheric Research Section | |||
| Atmospheric Chemistry | 1995 | ||
| Climate Dynamics | 1995 | ||
| Meoscale Dynamic Meteorology | 1995 | ||
| Large-scale Dynamic Meteorology | 1995 | ||
| Physical Meteorology | 1995 | ||
| -- Upper Atmospheric Research Section | |||
| Magnetospheric Physics | 1996 | ||
| Aeronomy | 1996 | ||
| Upper Atmospheric Reseach Facilities | 1996 | ||
| Solar Terrestrial Research | 1996 | ||
| NCAR | 1993 | ||
| Earth Sciences | |||
| Education & Human Resources | 1994 | ||
| Instrumentation & Facilities | 1992 | ||
| Continental Dynamics | 1995 | ||
| Tectonics | 1995 | ||
| Geophysics | 1995 | ||
| Geology & Paleontology | 1996 | ||
| Hydrological Sciences | 1996 | ||
| Petrology & Geochemistry | 1996 | ||
| Ocean Sciences | |||
| -- Ocean Centers & Facilities Section | |||
| Oceanographic Technology | 1994 | ||
| Ship Operations | 1994 | ||
| Shipboard Scientific Support Equipment | 1994 | ||
| Shipboard Technician | 1994 | ||
| -- Ocean Science Research Section | |||
| Special Projects Proposals | 1995 | ||
| Marine Geology & Geophysics | 1995 | ||
| Biological Oceanography | 1995 | ||
| Chemical Oceanography | 1995 | ||
| Physical Oceanography | 1995 | ||
| Ocean Drilling | 1995 | ||
| Mathematical and Physical Sciences | |||
| Astronomical Sciences | |||
| Astronomy & Ionosphere Center (NAIC) | 1996 | ||
| Optical Astronomy Observatories (NOAO) | 1996 | ||
| Radio Astronomy Observatory (NRAO) | 1996 | ||
| Extragalactic Astronomy & Cosmology | 1996 | ||
| Galactic Astronomy | 1996 | ||
| Advanced Technologies & Instrumentation | 1996 | ||
| Planetary Astronomy | 1996 | ||
| Stellar Astronomy & Astrophysics | 1996 | ||
| Electromagnetic Spectrum Management | 1996 | ||
| Chemistry | |||
| Analytical & Surface Chemistry | 1995 | ||
| Chemical Instrumentation | 1995 | ||
| Inorganic, Bioinorganic & Organometallic Chemistry | 1995 | ||
| Organic & Macromolecular Chemistry | 1995 | ||
| Physical Chemistry | 1995 | ||
| Special Projects Office | 1995 | ||
| Materials Research | |||
| Condensed Matter Physics | 1996 | ||
| Materials Theory | 1996 | ||
| Metals, Ceramics & Electronic Materials | 1996 | ||
| Solid-State Chemistry & Polymers | 1996 | ||
| National Facilities & Instrumentation | 1996 | ||
| Special Programs in Materials | 1996 | ||
| Mathematical Sciences | |||
| Classical Analysis | 1995 | ||
| Modern Analysis | 1995 | ||
| Statistics & Probability | 1995 | ||
| Topology & Foundations | 1995 | ||
| Algebra & Number Theory | 1995 | ||
| Applied Mathematics | 1995 | ||
| Computational Mathematics | 1995 | ||
| Geometric Analysis | 1995 | ||
| Special Projects | 1993 | ||
| Physics | |||
| Atomic, Molecular & Plasma Physics | 1994 | ||
| Elementary Particle Physics | 1994 | ||
| Gravitational Physics | 1994 | ||
| Nuclear Science - Intermediate Energy | 1994 | ||
| Nuclear Science - Nuclear Physics | 1994 | ||
| Theoretical Physics | 1994 | ||
| Social, Behavioral and Economic Sciences | |||
| International Programs | 1994 | ||
| Social, Behavioral & Economic Research | |||
| -- Economic, Decision & Mgt. Sciences Cluster | |||
| Economics | 1996 | ||
| Decision, Risk & Management Sciences | 1994 | ||
| -- Anthropology & Geographic Sciences Cluster | |||
| Cultural Anthropology | 1995 | ||
| Physical Anthropology | 1995 | ||
| Archeology | 1995 | ||
| Geography | 1996 | ||
| -- Social & Political Sciences Cluster | |||
| Sociology | 1996 | ||
| Political Science | 1994 | ||
| Law & Social Sciences | 1996 | ||
| -- Infrastructure, Methods & Science Studies Cluster | |||
| Ethics & Values Studies | 1996 | ||
| Science & Technology Studies | 1992 | ||
| Methodology, Measurement & Statistics | 1996 | ||
| -- Cognitive, Psych. & Language Sci. Cluster | |||
| Linguistics | 1996 | ||
| Human Cognition & Perception | 1996 | ||
| Social Psychology | 1996 | ||
| Office of Polar Programs | |||
| Polar Research Support | |||
| Polar Operations | 1995 | ||
| Science Support | 1995 | ||
| Waste Management | 1995 | ||
| Facilities | 1995 | ||
| Safety & Health | 1995 | ||
| Antarctic Sciences | |||
| Information | 1994 | ||
| Environmental Compliance | 1994 | ||
| Science Cluster | 1993 | ||
| Arctic Sciences | |||
| Arctic Science System | 1994 | ||
| Arctic Social Sciences | 1994 | ||
| Planning (IARPC) | 1994 | ||
| Science Cluster | 1993 | ||
| Office of Science and Technology Infrastructure | |||
| Academic Research Infrastructure | 1995 | ||
F. Exemptions and Changes in the Merit Review Process
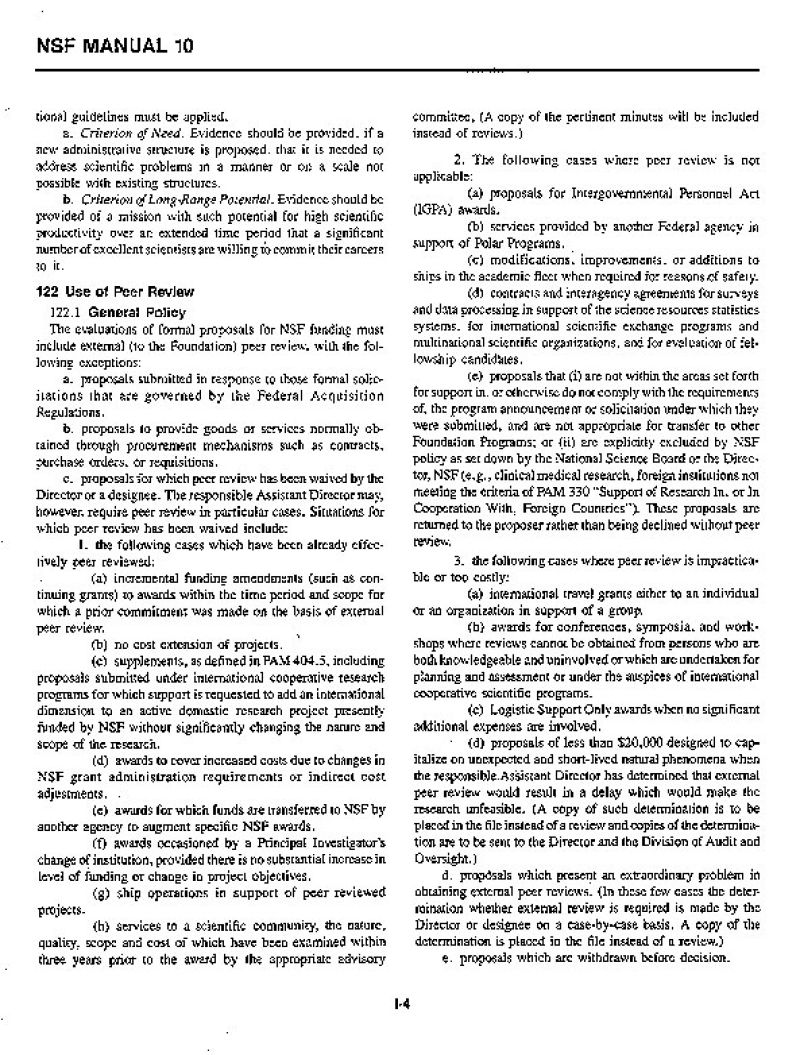
Authorized exemptions to the peer review process are listed in NSF Manual 10, Section 122 (below) and include routine award actions such as continuing grant increments and no-cost extensions. In special circumstances, the Director or designee may waive peer review requirements. Such waivers of peer review were granted twice during FY 1996; one for the Education and Human Resources (EHR) directorate and one for the Office of Policy Support (OPS).
No changes in the peer review system were implemented during FY 1996 which required Board approval. However, several significant activities involving the merit review system have taken place during the year, as described in the following section.
G. Other NSF Activities Related to the Merit Review System
In 1994, an applicant for an NSF grant filed suit against NSF in Federal Court asserting that the law required the agency to disclose the names of reviewers who wrote reviews of the applicant's declined proposal. In May, 1996, the U.S. Court of Appeals for the District of Columbia unanimously ruled that NSF may withhold the names of reviewers in connection with their reviews of specific proposals.
During FY 1996, NSF continued work on a major examination of its merit review system. One of the drivers of this effort was a Fall, 1994, Government Accounting Office (GAO) report on peer review at three government agencies. Partly in response to the GAO report, NSF established a senior-level Peer Review Study Group (PRSG) to examine relevant issues associated with merit review. Subsequently, several task groups of NSF staff examined the efficacy and implications of specific options and made recommendations for action. Most of the task groups' recommendations have been acted upon; a few are still under consideration.
In the process of obtaining external comments about the merit review system, several stresses and strains on the merit review system were identified that deserved further attention. To address these concerns, an external Proposal Review Advisory Team (PRAT) advisory committee was chartered in late FY 1996 to:
- Inventory and evaluate current stresses on the system;
- Develop feasible options for addressing the most important issues;
- Present pros and cons of the options, from the perspective of proposers and reviewers; and,
- Provide analysis and advice on related issues.
The PRAT met for two days in December, 1996, and is expected to present their report to the Deputy Director by the Summer of 1997.
A joint NSF and NSB Task Force on Merit Review was charged at the October, 1996, Board meeting with examining the Board's generic review criteria and making recommendations on retaining or changing them, along with accompanying guidance on their use. The Task Force carried out an assessment of how the criteria have been applied in the review process, and recommended that the criteria be simplified and the language be harmonized with the NSF Strategic Plan. The Task Force released a Discussion Report in November, 1996 and asked NSF to publicize it widely and solicit comments from the science and engineering community. The Task Force will study the comments and make recommendations to the Board in the Spring of 1997.
If you have any questions or comments concerning this report, please send to Dr. Robert Webber at the following email address: rwebber@nsf.gov.