National Science Foundation Merit Review FY 1998
NSB-99-28
March 15, 1999
Memorandum to members of the National Science Board
Subject: FY 1998 Report on the NSF Merit Review System
The attached FY 1998 Report on the NSF Merit Review System is submitted in accordance with National Science Board policy endorsed in March, 1977, and amended in March, 1984, which requests that the Director provide to the Board an annual report on the Foundation's proposal review system.
I trust you will find the report informative.
Rita R. Colwell
Director
Highlights
- This report responds to a long-standing NSB policy requesting that the NSF Director submit an annual report on the NSF merit review system.
- During FY 1998 NSF received 28,321 proposals. The number of proposals received annually was stable at about 30,000 from 1993 to 1997.
- A total of 9,280 competitive proposals were funded in FY 1998, a decrease of 5.9% from the previous year. The number of awards made each year has fluctuated between approximately 9,000 and 10,000 over the past five years. The number of awards made in FY 1998 was 7 percent lower than the number made in FY 1994.
- The NSF-wide funding rate was 33 percent in FY 1998, representing no change from the previous year and remaining level with the five-year maximum reached in FY1994. Directorate funding rates in FY 1998 ranged from 25 percent to 41 percent.
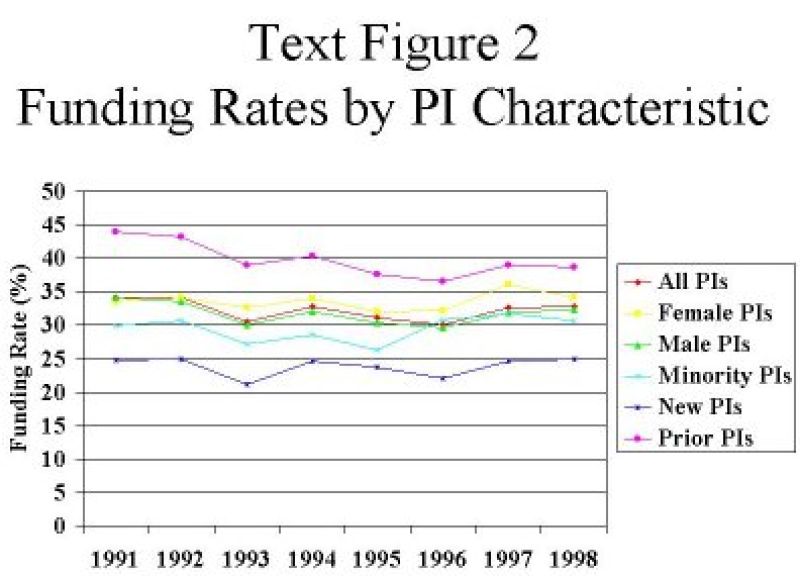
- Proposals from minority Principal Investigators (PIs) in FY 1998 were funded below the NSF average (31 and 33 percent respectively). Proposals from female PIs in FY 1998 were funded above the NSF average (34 and 33 percent respectively).
- Proposals from PIs who had received an NSF award in a previous fiscal year (prior PIs) were funded at a higher rate than proposals from new PIs (39 and 25 percent, respectively in FY 1998). This gap has remained stable for several years.
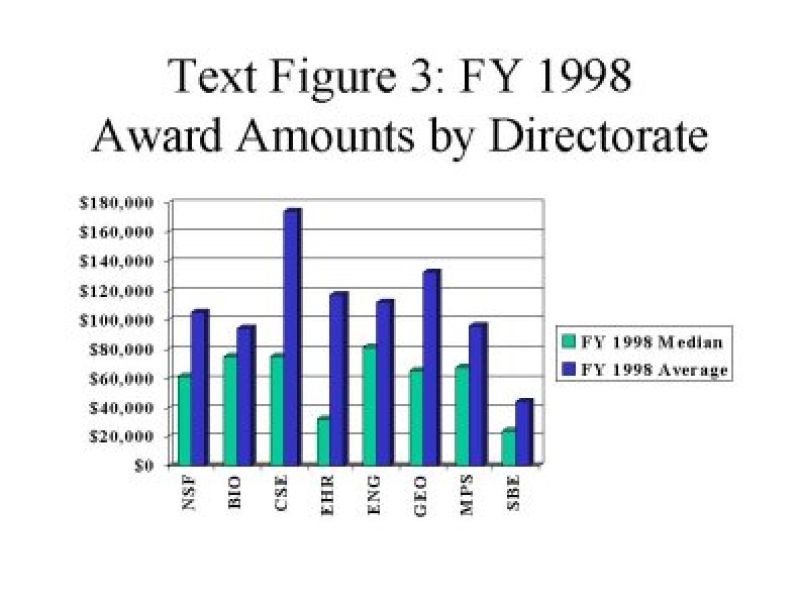
- Award size increased from the previous fiscal year. The median NSF award amount in FY 1998 was $61,666; the average was $105,382.
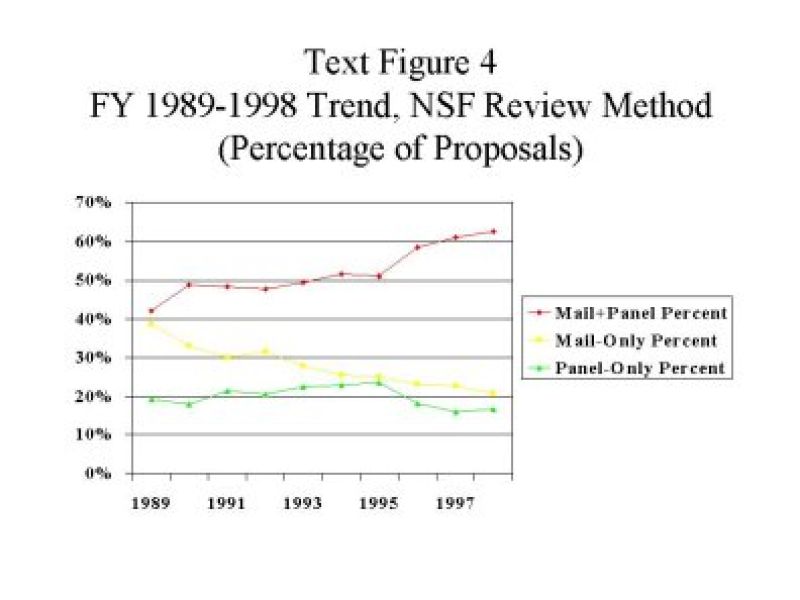
- The most frequent method of proposal review was a combination of mail and panel methods. Sixty-three percent of proposals were reviewed in this manner in FY 1998, an increase of 21 percent in five years.
- NSF received a total of more than 244,000 reviews in FY 1998, for an average of 8.6 reviews per proposal. The number of reviews received per proposal varied according to review method: 10.6 reviews per proposal for mail-plus-panel review, 5.9 reviews per proposal for panel-only review, and 4.6 reviews per proposal for mail-only review. The response rate to mail review requests remained level at 62 percent.
- Both proposal pressure and average award size for Small Grants for Exploratory Research (SGER) continued to increase in FY 1998.
- There were 53 requests for formal reconsideration of declinations submitted to Assistant Directors during FY 1998; 3 of these declinations were reversed at the directorate level. 3 requests for reconsideration were submitted to the Deputy Director; all 3 of these declinations were upheld.
- There were no lawsuits involving the NSF merit review system in FY 1998.
- In March 1997, the NSB approved changes to the merit review criteria to reflect the Foundation's strategic plan more effectively. These changes became operational at the start of FY 1998.
The FY 1998 Report on the NSF Merit Review System responds to a National Science Board (NSB) policy endorsed in 1977 and amended in 1984, requesting that the Director of the National Science Foundation (NSF) submit an annual report on the NSF proposal review system. This report provides summary information about levels of proposal and award activity and the process by which proposals are reviewed and awarded.
 On this page
A. Proposals and Awards
Overview
During FY 1998, NSF took action on 28,321 competitive, merit reviewed research and education proposals. The number of proposals reviewed annually by NSF had been reasonably stable at about 30,000 proposals since 1994. This drop to the 28,000 level has not been analyzed yet.
NSF funding was awarded to 9,280 of the proposals, resulting in an overall-funding rate of 33 percent. As shown in Text Figure 1, the number of awards made each year has varied between approximately 9,000 and 10,000. In FY 1998 the number of awards decreased by 5.9 percent relative to FY 1997 funding rate. Funding rates vary among directorates, ranging from 25 percent to 41 percent as shown in Appendix Table 1.
| Fiscal Year 1994 | Fiscal Year 1995 | Fiscal Year 1996 | Fiscal Year 1997 | Fiscal Year 1998 | |
|---|---|---|---|---|---|
| Proposals | 30,399 | 30,700 | 30,231 | 30,189 | 28,321 |
| Awards | 9,976 | 9,563 | 9,071 | 9,864 | 9,280 |
| Funding Rate (%) | 33 | 31 | 30 | 33 | 33 |
| Fiscal Year 1994 | Fiscal Year 1995 | Fiscal Year 1996 | Fiscal Year 1997 | Fiscal Year 1998 | Five-year Total | Five-year Average | |
| NSF Proposals | 30,399 | 30,700 | 30,231 | 30,189 | 28,321 | 149,840 | 29,968 |
| NSF Awards | 9,976 | 9,563 | 9,071 | 9,864 | 9,280 | 47,754 | 9,551 |
| NSF Funding Rate (%) | 33 | 31 | 30 | 33 | 33 | 32 | 32 |
| BIO Proposals | 4,761 | 5,255 | 5,676 | 5,209 | 4,857 | 25,758 | 5,152 |
| BIO Awards | 1,397 | 1,383 | 1,328 | 1,416 | 1,403 | 6,927 | 1,385 |
| BIO Funding Rate (%) | 29 | 26 | 23 | 27 | 29 | 27 | 27 |
| CISE Proposals | 1,919 | 2,067 | 1,931 | 2,010 | 2,035 | 9,962 | 1,992 |
| CISE Awards | 707 | 722 | 647 | 731 | 706 | 3,513 | 703 |
| CISE Funding Rate (%) | 37 | 35 | 34 | 36 | 35 | 35 | 35 |
| EHR Proposals | 4,892 | 4,979 | 3,732 | 3,369 | 3,562 | 20,534 | 4,107 |
| EHR Awards | 1,633 | 1,475 | 1,326 | 1,191 | 1,223 | 6,848 | 1,370 |
| EHR Funding Rate (%) | 33 | 30 | 36 | 35 | 34 | 33 | 34 |
| ENG Proposals | 6,430 | 5,740 | 5,956 | 6,076 | 5,590 | 29,792 | 5,958 |
| ENG Awards | 1,532 | 1,473 | 1,383 | 1,573 | 1,390 | 7,351 | 1,470 |
| ENG Funding Rate (%) | 24 | 26 | 23 | 26 | 25 | 25 | 25 |
| GEO Proposals | 3,649 | 3,422 | 3,723 | 3,950 | 3,317 | 18,061 | 3,612 |
| GEO Awards | 1,311 | 1,200 | 1,161 | 1,337 | 1,227 | 6,236 | 1,247 |
| GEO Funding Rate (%) | 36 | 35 | 31 | 34 | 37 | 35 | 35 |
| MPS Proposals | 4,998 | 5,203 | 4,958 | 5,536 | 5,265 | 25,960 | 5,192 |
| MPS Awards | 1,976 | 1,864 | 1,817 | 1,993 | 1,835 | 9,485 | 1,897 |
| MPS Funding Rate (%) | 40 | 36 | 37 | 36 | 35 | 37 | 37 |
| SBE Proposals | 3,104 | 3,490 | 3,453 | 3,286 | 3,092 | 16,425 | 3,285 |
| SBE Awards | 1,089 | 1,149 | 1,137 | 1,223 | 1,263 | 5,861 | 1,172 |
| SBE Funding Rate (%) | 35 | 33 | 33 | 37 | 41 | 36 | 36 |
| Other Proposals | 646 | 544 | 802 | 753 | 603 | 3,348 | 670 |
| Other Awards | 331 | 297 | 272 | 400 | 233 | 1,533 | 307 |
| Other Funding Rate (%) | 51 | 55 | 34 | 53 | 39 | 46 | 46 |
Notes:
"Competitively reviewed" proposals and awards refer to proposal actions for research, education and training which are processed through NSF's external merit review system each year. These figures do not include 6,963 second-year and later incremental awards during FY 1998 for "continuing grants" which are competitively reviewed in the first year of the award. Also excluded are 2,683 supplements which are not subject to external merit review, and 110 contracts which are reviewed with special criteria. "Other" organizational units include Office of Polar Programs and Office of Integrative Activities.
Source: NSF Enterprise Information System, as of February, 1999
In addition to funding proposals that were competitively reviewed during FY 1998, NSF awarded 6,963 continuing grant increments (CGIs) based on proposals which had been competitively reviewed in earlier years. CGIs are funded in annual increments from current year appropriations. The CGI procedure complements the other major award instrument - standard grants - where all funds for a multiple year project are obligated out of a single year appropriation. NSF policy limits the amount of future year CGI commitments to 65 percent of a program's current fiscal year operating plan.
Characteristics of Principal Investigators
The number of proposals received from female Principal Investigators (PIs) has increased in most years since 1991. The same has been true for PIs from minority groups, though the increase has been slower than for female PIs (10 percent increase from FY 1991 to 1998 for minority PIs; 19 percent for female PIs.) During FY 1998, about 20 percent of competitively reviewed proposals were from female PIs (a one- percent increase from FY 1997, with a corresponding decrease in proposals from male PIs), and four percent were from minority PIs (level with FY 1997.)
Funding rates of proposals from female PIs have been higher than proposals from male PIs for the past five years. The funding rates for proposals from minority PIs have been above the overall NSF funding rate for only one of the past eight years.
Forty-three percent of the competitively reviewed proposals in FY 1998 were from PIs who had not received an NSF award in a previous fiscal year ('new PIs'). This percentage represents a decrease from 44 percent in FY 1997 and 51 percent in FY 1991. The funding rate for proposals from PIs who had received an NSF award (prior PIs) was higher than proposals from new PIs (39 percent and 25 percent, respectively in FY 1998). The difference in funding rates between proposals from new and prior PIs has remained approximately level since 1993.
Trends in funding rate for all PIs, female and minority PIs, and prior and new PIs are graphed in Text Figure 2. Proposals, awards, funding rates and trends by PI characteristics are presented in Appendix Table 2.
Fiscal Year 1991 | Fiscal Year 1992 | Fiscal Year 1993 | Fiscal Year 1994 | Fiscal Year 1995 | Fiscal Year 1996 | Fiscal Year 1997 | Fiscal Year 1998 |
|---|---|---|---|---|---|---|---|
| All PIs: Proposals | 28,866 | 30,319 | 30,003 | 30,399 | 30,700 | 30,231 | 30,189 |
| All PIs: Awards | 9,855 | 10,356 | 9,148 | 9,976 | 9,563 | 9,071 | 9,864 |
| All PIs: Funding Rate (%) | 34 | 34 | 30 | 33 | 31 | 30 | 33 |
| Female PIs: Proposals | 4,716 | 4,447 | 4,468 | 4,833 | 4,940 | 5,162 | 5,383 |
| Female PIs: Awards | 1,582 | 1,517 | 1,461 | 1,639 | 1,583 | 1,663 | 1,940 |
| Female PIs: Funding Rate (%) | 34 | 34 | 33 | 34 | 32 | 32 | 36 |
| Male PIs: Proposals | 23,964 | 25,320 | 25,132 | 25,019 | 25,152 | 24,716 | 24,451 |
| Male PIs: Awards | 8,171 | 8,504 | 7,561 | 8,018 | 7,638 | 7,302 | 7,799 |
| Male PIs: Funding Rate (%) | 34 | 34 | 30 | 32 | 30 | 30 | 32 |
| Minority PIs: Proposals | 1,136 | 1,380 | 1,324 | 1,354 | 1,417 | 1,444 | 1,338 |
| Minority PIs: Awards | 34 | 423 | 361 | 387 | 372 | 445 | 425 |
| Minority PIs: Funding Rate (%) | 30 | 31 | 27 | 29 | 26 | 31 | 32 |
| New PIs: Proposals | 14,712 | 14,993 | 14,287 | 14,569 | 14,198 | 13,632 | 13,277 |
| New PIs: Awards | 3,686 | 3,736 | 3,028 | 3,593 | 3,366 | 3,015 | 3,268 |
| New PIs: Funding Rate (%) | 25 | 25 | 21 | 25 | 24 | 22 | 25 |
| Prior PIs: Proposals | 14,154 | 15,326 | 15,716 | 15,830 | 16,502 | 16,599 | 16,912 |
| Prior PIs: Awards | 6,219 | 6,620 | 6,120 | 6,383 | 6,197 | 6,056 | 6,596 |
| Prior PIs: Funding Rate (%) | 44 | 43 | 39 | 40 | 38 | 36 | 39 |
Notes:
"Competitively reviewed" proposals and awards are actions for research, education and training processed through NSF's merit review system each year. "Gender" is based on self-reported information from the PI's most recent proposal. "Minority" is based on the PI's ethnic/racial status as reported to NSF on the most recent proposal. PIs can decline to report their ethnic/racial status. Includes American Indian, Alaskan Native, Black, Hispanic, and Pacific Islander and excludes Asian and White-Not of Hispanic Origin.
Source: NSF Enterprise Information System, as of February, 1999
Award Amounts
The median annual award amount (adjusted for multiple year projects) among competitive awards made during FY 1998 was $61,666, a 5.5 percent increase from FY 1997. The average award amount in FY 1998 was $105,382, an increase of 9.6 percent from FY 1997. The difference between the median and average award amounts reflects the effect of numerous small awards on the median, and a few large awards for centers, facilities, and large systemic initiatives on the average award amount. Award amounts have been consistent over the past decade, when adjusted to constant dollars as measured by the Consumer Price Index. There are considerable variations among directorates, as shown in Text Figure 3. Data on median and average award amounts from FY 1994-1998 are presented by directorate in Appendix Table 3.
Fiscal Year 1994 | Fiscal Year 1995 | Fiscal Year 1996 | Fiscal Year 1997 | Fiscal Year 1998 |
|---|---|---|---|---|
| NSF Median | $53,650 | $53,548 | $53,813 | $58,433 |
| NSF Average | $99,528 | $85,538 | $89,388 | $96,152 |
| BIO Median | $67,447 | $67,077 | $64,549 | $73,166 |
| BIO Average | $70,840 | $71,900 | $74,623 | $77,893 |
| CSE Median | $49,495 | $52,000 | $54,453 | $68,833 |
| CSE Average | $72,258 | $90,750 | $86,631 | $100,646 |
| EHR Median | $37,887 | $33,993 | $26,650 | $25,746 |
| EHR Average | $107,333 | $130,069 | $100,720 | $136,721 |
| ENG Median | $66,343 | $76,780 | $76,868 | $78,463 |
| ENG Average | $85,768 | $88,494 | $92,015 | $93,100 |
| GEO Median | $60,732 | $58,763 | $61,439 | $61,759 |
| GEO Average | $148,782 | $75,157 | $110,298 | $99,081 |
| MPS Median | $53,543 | $54,623 | $54,325 | $60,000 |
| MPS Average | $124,441 | $80,826 | $101,261 | $95,992 |
| SBE Median | $21,460 | $22,128 | $19,560 | $21,420 |
| SBE Average | $37,289 | $38,244 | $42,480 | $44,909 |
Note: Median and average are based on all awards competitively reviewed during FY 1998.
Source: NSF Enterprise Information System, as of February, 1999.
B. Methods of Proposal Review
Peer Evaluation and Merit Review
The involvement of knowledgeable peers from outside the Foundation in the review of proposals is the keystone of NSF's proposal review system. Their judgements of the extent to which proposals address established criteria are vital for informing NSF staff and influencing funding recommendations. For this reason, NSF's system of proposal review can accurately be characterized as "merit review with peer evaluation."
Review Processes used at NSF
NSF programs obtain external peer review by two principal methods, mail and panel. In addition to mail and panel reviews, site visits by NSF staff and external peers are often used to review proposals for large facilities, centers, and systemic reform initiatives. NSF program officers are given discretion in the specific use of review methods, subject to supervisory approval. For example, some programs try to reduce proposal pressure by requiring submission of preliminary proposals. Review of preliminary proposals varies widely, ranging from non-binding advice form program officers to proposers, to binding decisions from external reviewers. Systematic data on the use of preliminary proposals are not available.
In "mail-only" reviews, peers are sent proposals and asked to submit written comments to NSF by postal mail, facsimile, electronic mail, or through FastLane, NSF's Web-based system for electronic proposal submission and review. These mail reviews are then used by the NSF program officer directly to support a recommendation for award or decline.
"Panel-only" review refers to the process of soliciting reviews only from those peers who meet in a panel review setting to discuss their reviews and provide advice directly to the program officer. Most programs that use this process mail proposals out to panelists and receive their reviews prior to the panel meeting. Other programs provide panelists with access to the proposals at the beginning of the panel meeting, allowing them a period of time during which they prepare their reviews at the meeting.
Most proposals submitted to NSF are reviewed using some combination of these two processes ("mail-plus-panel" review). Those programs that employ the mail-plus-panel review process have developed several different configurations, such as:
- A peer is asked to submit a written mail review and also serve as a panelist, in effect contributing two reviews for each proposal.
- A peer is asked to participate only as a panelist, with responsibility only for reviewing and discussing mail reviews written by others and providing verbal and/or written advice to the program officer.
The mail-plus-panel method was used for 63 percent of proposals reviewed during FY 1998; 21 percent of proposals were reviewed by mail-only, and 17 percent by panel-only. Directorates vary in their use of proposal review methods. Mail-plus-panel review was the most common review process used in the BIO, CSE, ENG, GEO, and SBE Directorates. Mail-only review was the predominant mode of review in MPS. Panel-only review was the most commonly used method in EHR. Directorate-level data on the use of different review processes during FY 1998 are presented in Appendix Table 4.
| Total | Mail + Panel | Mail-Only | Panel-Only | ||||
|---|---|---|---|---|---|---|---|
| Directorate | Proposals | Proposals | Percent | Proposals | Percent | Proposals | Percent |
| NSF | 28,528 | 17,838 | 63% | 5,926 | 21% | 4,764 | 17% |
| BIO | 4,827 | 4,541 | 94% | 236 | 5% | 50 | 1% |
| CSE | 2,057 | 1,607 | 78% | 154 | 7% | 296 | 14% |
| EHR | 3,507 | 922 | 26% | 202 | 6% | 2,383 | 68% |
| ENG | 5,368 | 3,304 | 62% | 943 | 18% | 1,121 | 21% |
| GEO | 3,383 | 2,617 | 77% | 702 | 21% | 64 | 2% |
| MPS | 5,284 | 1,993 | 38% | 2,752 | 52% | 539 | 10% |
| SBE | 3,008 | 1,979 | 66% | 720 | 24% | 309 | 10% |
| Other | 1,094 | 875 | 80% | 217 | 20% | 2 | 0% |
Note:
"Other" includes the Office of Polar Programs and the Office of Integrative Activities.
Source: NSF Enterprise Information System, as of February 1999.
The use of various review processes has varied over time. The percentage of NSF proposals reviewed by mail-plus-panel has increased from 42 to 63 percent of all proposals since FY 1989.
There has been a steady decline in the use of mail-only review from 39 to 21 percent during the past decade. The use of panel-only review has varied less than other methods, increasing slowly for several years and then declining from 24 to 17 percent during the past four years. These trends are shown in Text Figure 4, and the corresponding data are presented in Appendix Table 5.
| Total | Mail + Panel | Mail-Only | Panel-Only | ||||
|---|---|---|---|---|---|---|---|
| FY | Proposals | Proposals | Percent | Proposals | Percent | Proposals | Percent |
| 1989 | 27,167 | 11,411 | 42% | 10,512 | 39% | 5,244 | 19% |
| 1990 | 28,179 | 13,784 | 49% | 9,291 | 33% | 5,104 | 18% |
| 1991 | 28,087 | 13,600 | 48% | 8,449 | 30% | 6,038 | 21% |
| 1992 | 29,187 | 13,980 | 48% | 9,219 | 32% | 5,988 | 21% |
| 1993 | 29,127 | 14,445 | 50% | 8,120 | 28% | 6,562 | 23% |
| 1994 | 29,898 | 15,394 | 51% | 7,611 | 25% | 6,893 | 23% |
| 1995 | 30,131 | 15,430 | 51% | 7,575 | 25% | 7,126 | 24% |
| 1996 | 29,617 | 17,317 | 58% | 6,875 | 23% | 5,425 | 18% |
| 1997 | 29,481 | 17,996 | 61% | 6,732 | 23% | 4,753 | 16% |
| 1998 | 28,528 | 17,838 | 63% | 5,926 | 21% | 4,764 | 17% |
Note:
Number of proposals differs slightly from previous table due to coding variations.
Source: NSF Enterprise Information System, as of February 1999.
NSF policy states that each recommendation for final action on a proposal must be accompanied by at least three external reviews, unless the requirement has been waived (see section F, below). The total numbers of reviews and the average numbers of reviews peer proposal obtained by these different methods are presented in Text Figure 5. Directorate-level data for FY 1998 are presented in Appendix Table 6.
All Methods | Mail-plus-Panel | Mail-Only | Panel-Only |
|---|---|---|---|
| # of Reviews | 244,919 | 189,415 | 27,323 |
| # of Proposals | 28,528 | 17,838 | 5,926 |
| Reviews per Proposal | 8.6 | 10.6 | 4.6 |
| Methods of Review | |||||
|---|---|---|---|---|---|
| Directorate | All Methods | Mail + Panel | Mail-Only | Panel-Only | |
| BIO | Reviews | 78,640 | 77,199 | 995 | 446 |
| Proposals | 4,827 | 4,541 | 236 | 50 | |
| Rev/Prop | 16.3 | 17.0 | 4.2 | 8.9 | |
| CSE | Reviews | 10,702 | 8,797 | 658 | 1,247 |
| Proposals | 2,057 | 1,607 | 154 | 296 | |
| Rev/Prop | 5.2 | 5.5 | 4.3 | 4.2 | |
| EHR | Reviews | 20,373 | 6,870 | 889 | 12,614 |
| Proposals | 3,507 | 922 | 202 | 2,383 | |
| Rev/Prop | 5.8 | 7.5 | 4.4 | 5.3 | |
| ENG | Reviews | 22,282 | 13,551 | 4,256 | 4,475 |
| Proposals | 5,368 | 3,304 | 943 | 1,121 | |
| Rev/Prop | 4.2 | 4.1 | 4.5 | 4.0 | |
| GEO | Reviews | 35,808 | 31,707 | 3,658 | 443 |
| Proposals | 3,383 | 2,617 | 702 | 64 | |
| Rev/Prop | 10.6 | 12.1 | 5.2 | 6.9 | |
| MPS | Reviews | 41,503 | 21,834 | 13,052 | 6,617 |
| Proposals | 5,284 | 1,993 | 2,752 | 539 | |
| Rev/Prop | 7.9 | 11.0 | 4.7 | 12.3 | |
| SBE | Reviews | 30,028 | 24,935 | 2,761 | 2,332 |
| Proposals | 3,008 | 1,979 | 720 | 309 | |
| Rev/Prop | 10.0 | 12.6 | 3.8 | 7.5 | |
| Others | Reviews | 5,583 | 4,522 | 1,054 | 7 |
| Proposals | 1,094 | 875 | 217 | 2 | |
| Rev/Prop | 5.1 | 5.2 | 4.9 | 3.5 | |
Reviewers
Diversity of the reviewer pool is an important feature of the NSF merit review system. Reviewers from diverse backgrounds help ensure that a wide range of perspectives are taken into consideration in the review process. NSF emphasizes reviewer diversity through a variety of processes, including use of a large and expanding Foundation-wide reviewer database, explicit policy guidance, mandatory training for all program officers, and directorate-level initiatives. NSF maintains a central electronic database of 241,000 reviewers. For proposal decisions in FY 1998, 47,000 of these reviewers were sent one or more proposals for mail review, 31,700 reviewed at least one proposal by mail, and 7,800 reviewers served as panelists. In all, 51,000 individuals either served on a panel, were sent a proposal for mail review, or served in both functions.
Potential reviewers are identified from a variety of sources including applicant suggestions, references attached to proposals and published papers, and input from mail reviewers, panelists, and visiting scientists. During FY 1998, approximately 28,500 of the 241,000 records now in the reviewer database were either added or updated.
Participation in the peer review process is voluntary. Panelists are reimbursed for expenses; mail reviewers receive no financial compensation. In FY 1998, 62 percent of requests for mail reviews produced responses, which represents a slight decrease from the 64 percent response rate that has been stable since 1991.
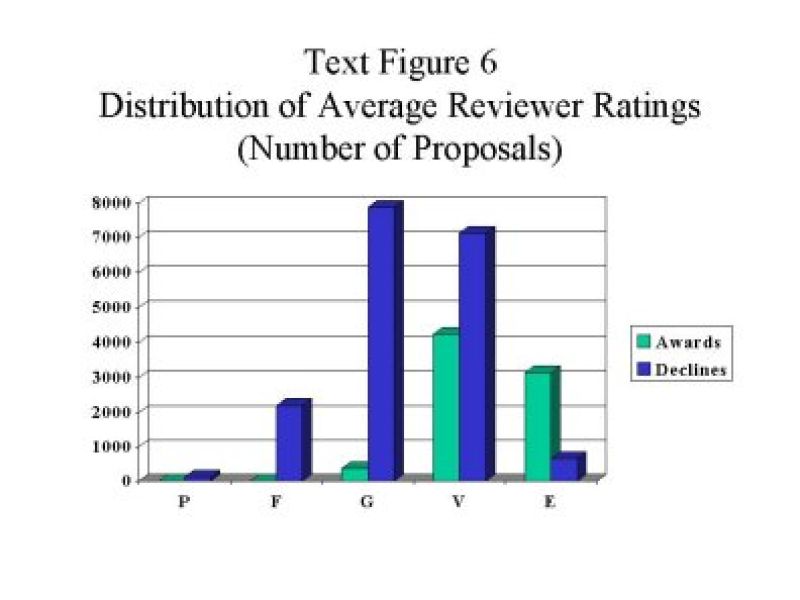
Reviewer Proposal Ratings
The NSF merit review system emphasizes reviewer narratives over summary ratings. Summary ratings are but one indicator of reviewer judgment of the proposal quality. The written narratives provided by reviewers, the deliberations by panel members, and the expert opinions provided by program officers are all important components of the merit review system. No one component is allowed to dominate over the others.
The distribution of average summary ratings of reviews for awarded and declined proposals is provided in Text Figure 6. Only those ratings provided for mail-only and mail-plus-panel reviewers have been included. Panel-only reviewers often submit comments without a summary rating. These data indicate considerable overlap among the average reviewer ratings of successful and unsuccessful proposals, most notably in the range of "very good" average ratings. The judgment of NFS staff is essential to making this difficult separation between awards and declines.
NSF Program Officers
The narrative comments and summary ratings provided by external reviewers are essential inputs in NSF's system of merit review. Once received, these inputs inform the judgment of the program officers who formulate award and decline recommendations to NSF's senior management. These program officers are scientists, engineers, and educators to whom NSF looks for expert judgment and program management. In making recommendations to award or decline proposals, these highly qualified individuals produce and manage a portfolio of awards addressing NSF's strategic goals and related factors such as;
- Contributions to human resource and institutional infrastructure development,
- Support for "risky" proposals with potential for significant advances in a field,
- Encouragement of interdisciplinary activities, and
- Achievement of program-level objectives and initiatives.
The number of program officers employed by NSF has remained stable at slightly over 400 for the past five years, despite increases in proposal pressure and general workload. Depending on their professional experience, program officers are classified as assistant program director, associate program director, or program director. They can be permanent NSF employees or temporary employees. Some temporary program officers are "on loan" as visiting scientists, engineers, and educators (VSEEs) for up to three years from their host institutions. Others are employed through grants to the home institutions under the terms of the Intergovernmental Personnel Act. The distribution of these program officers among these and other categories is presented in Text Figure 7.
Review of Program Officer Award Recommendations
Each program officer's recommendation to award or decline a proposal is subject to a programmatic review by a higher level reviewing official (usually the division director), and an administrative review by a grants officer in the Office of Budget, Finance, and Award Management (BFA). All award recommendations in excess of $1.5 million in any one project year or $6 million over five years must be reviewed by the Director's Review Board (DRB). Awards in excess of a $3 million commitment during a project year, or $15 million over five years, require approval by the National Science Board.
Assistant Program Directors | Associate Program Directors | Program Directors | Total |
|---|---|---|---|
| Total | 9 2.3% | 38 9.8% | 339 87.8% |
| Male | 3 1.2% | 25 10.4% | 213 88.4% |
| Female | 6 4.3% | 12 8.6% | 121 87.1% |
| Minority | 1 1.4% | 6 8.5% | 64 90.1% |
| White, Non-Hispanic | 8 2.6% | 30 9.9% | 266 87.5% |
| Permanent | 7 3.1% | 28 12.4% | 190 84.4% |
| VSEE | 0.0% | 2 7.7% | 24 92.3% |
| Temporary | 1 3.3% | 0.0% | 29 96.7% |
| IPA | 1 1.0% | 8 7.6% | 96 91.4% |
Notes: Percentages of all Program Officers are presented and may not add to 100% due to rounding. VSEE: Individual employed as a Visiting Scientist, Engineer, or Educator (formerly termed "Rotator") IPA: Individual employed under the Intergovernmental Personnel Act
Source: NSF Division of Human Resource Management
C. Requests for Reconsideration of Declined Proposals
NSF policy includes several mechanisms that provide proposers with information on how the review process led to a decline recommendation, and on procedures for obtaining additional explanations for declinations. These policies help to ensure that NSF's review has been fair and reasonable, and that NSF maintains the openness, quality, and integrity of the merit review process.
Every proposer receives from the NSF program officer a description of the context in which the proposal was reviewed, along with a verbatim copy of each review that was considered in the review process. A declined PI may ask the cognizant program officer for additional clarification of the decision. If after considering this additional information a PI is not satisfied that the proposal was fairly handled and reasonably reviewed, he or she may request formal reconsideration from the cognizant assistant director (AD). This request can be based on the PI's perception of procedural errors or on disagreements over the substantive issues dealt with by reviewers. If the AD upholds the original action, the applicant's institution may request a second reconsideration from the Foundation's Deputy Director (O/DD).
On average, NSF annually declines over 20,000 proposals but receives, on average, only 50 requests for formal reconsideration. Most program-level decisions are upheld in the reconsideration process. The number of requests for formal reconsideration and resulting decisions at both the AD and O/DD levels from FY 1994 through FY 1998 are displayed in Appendix Table 7.
| Fiscal Year | ||||||
|---|---|---|---|---|---|---|
| 1994 | 1995 | 1996 | 1997 | 1998 | ||
| First Level Reviews (by Assistant Directors): | ||||||
| Second Level Reviews (by Deputy Director): | ||||||
| NSF | Requests | 28 | 38 | 46 | 39 | 53 |
| >Upheld | 30 | 37 | 45 | 34 | 48 | |
| >Reversed | 0 | 1 | 1 | 4 | 3 | |
| BIO | Requests | 5 | 4 | 3 | 4 | 6 |
| >Upheld | 5 | 4 | 3 | 2 | 6 | |
| >Reversed | 0 | 0 | 0 | 2 | 0 | |
| CSE | Requests | 0 | 3 | 1 | 2 | 3 |
| >Upheld | 0 | 3 | 1 | 2 | 3 | |
| >Reversed | 0 | 0 | 0 | 0 | 0 | |
| EHR | Requests | 4 | 3 | 8 | 4 | 6 |
| >Upheld | 6 | 3 | 8 | 4 | 5 | |
| >Reversed | 0 | 0 | 0 | 0 | 1 | |
| ENG | Requests | 6 | 3 | 5 | 9 | 5 |
| >Upheld | 6 | 3 | 5 | 9 | 4 | |
| >Reversed | 0 | 0 | 0 | 0 | 0 | |
| GEO | Requests | 5 | 5 | 4 | 2 | 2 |
| >Upheld | 5 | 5 | 4 | 2 | 2 | |
| >Reversed | 0 | 0 | 0 | 0 | 0 | |
| MPS | Requests | 8 | 18 | 20 | 17 | 25 |
| >Upheld | 8 | 17 | 19 | 15 | 22 | |
| >Reversed | 0 | 1 | 1 | 2 | 2 | |
| SBE | Requests | 0 | 2 | 1 | 2 | 3 |
| >Upheld | 0 | 2 | 1 | 1 | 3 | |
| >Reversed | 0 | 0 | 0 | 0 | 0 | |
| Other | Requests | 0 | 0 | 4 | 0 | 0 |
| >Upheld | 0 | 0 | 4 | 0 | 0 | |
| >Reversed | 0 | 0 | 0 | 0 | 0 | |
| O/DD | Requests | 8 | 11 | 7 | 4 | 3 |
| >Upheld | 9 | 10 | 7 | 4 | 3 | |
| >Reversed | 0 | 0 | 0 | 0 | 0 | |
Notes: The number of decisions (upheld or reversed) may not equal the number of requests in each year due to carryover of pending reconsideration requests.
D. Small Grants for Exploratory Research (SGER)
Since the beginning of FY 1990, the Small Grants for Exploratory Research (SGER) option has permitted program officers throughout the Foundation to make short-term (one to two years), small-scale (less than $50 K) grants without formal external review. Characteristics of activities which can be supported by an SGER award include:
- Preliminary work on untested and novel ideas;
- Application of new approaches to "old" topics;
- Ventures into emerging research areas; and
- Narrow windows of opportunity for data collection, such as natural disasters and infrequent phenomena.
The funding rate for SGERs in FY 1998 was 83 percent. The SGER funding rate is much higher than for regular, competitively reviewed proposals in large part because potential SGER applicants are encouraged to contact an NSF program officer before submitting an SGER proposal to determine its appropriateness for the SGER funding option. As potential SGER applicants have become familiar with this practice, the SGER funding rate has increased from 55 percent in its first year (FY 1990) to 83 percent in FY 1998. Additional details are shown in Text Figure 8.
FY 1991 | FY 1992 | FY 1993 | FY 1994 | FY 1995 | FY 1996 | FY 1997 | FY 1998 |
|---|---|---|---|---|---|---|---|
| Proposal | 3 | 300 | 309 | 258 | 228 | 205 | 242 |
| Awards | 185 | 4 | 213 | 185 | 168 | 144 | 3 |
| Funding Rate | 58% | 65% | 69% | 72% | 74% | 70% | 80% |
NSF management has been concerned by the decrease in SGER proposal pressure since the activity's inception in 1990. In response, Staff Memorandum O/D 97-06 (dated June 5, 1997) announced a three-year experiment that increases the SGER award limit from $50,000 to $100,000. Program officers were also given permission to grant six-month extensions and supplements of up to $50,000 for extant SGER awards. (EHR and BIO elected not to offer these time extensions or supplements.)
Coincident with these policy changes, the downward trends in SGER proposal pressure and number of awards were reversed in FY 1997. NSF received 242 SGER proposals in FY 1997 and made 193 awards. NSF received 299 SGER proposals in FY 1998 and made 247 awards. Directorates vary in the degree to which their program officers discourage potential proposers from submitting inappropriate ideas as formal SGER proposals. As a result, FY 1998 funding rates for SGER proposals varied among directorates from 56 to 96 percent. Directorate-level data on SGER proposal pressure and funding rates are presented in Appendix Table 8.
The total amount awarded to SGERs also increased in FY 1998 to $12,320,200. This represents an all-time high for SGER support and a 46 percent increase from FY 1997. The average SGER award amount in FY 1998 was $49,879, a 14 percent increase relative to the FY 1997 average award amount of $43,591. Despite these increases, the total NSF investment in SGERs remains less than one percent of the operating budget for research and education, far below the five percent that program officers may commit to SGER awards. The history of SGER awards by directorate from FY 1996 to FY 1998 is presented in Appendix Table 9.
| Fiscal Year | Eight-year | ||||||||||
|---|---|---|---|---|---|---|---|---|---|---|---|
| 1991 | 1992 | 1993 | 1994 | 1995 | 1996 | 1997 | 1998 | Total | Average | ||
| NSF | Proposals | 319 | 300 | 309 | 258 | 228 | 205 | 242 | 299 | 2160 | 270 |
| Awards | 185 | 194 | 213 | 185 | 168 | 144 | 193 | 247 | 1529 | 191 | |
| Funding Rate | 58% | 65% | 69% | 72% | 74% | 70% | 80% | 83% | 71% | 71% | |
| BIO | Proposals | 76 | 81 | 80 | 63 | 56 | 50 | 44 | 59 | 509 | 64 |
| Awards | 42 | 39 | 57 | 39 | 40 | 28 | 29 | 48 | 322 | 40 | |
| Funding Rate | 55% | 48% | 71% | 62% | 71% | 56% | 66% | 81% | 63% | 63% | |
| CSE | Proposals | 14 | 14 | 15 | 11 | 18 | 22 | 23 | 21 | 138 | 17 |
| Awards | 7 | 9 | 11 | 9 | 18 | 19 | 23 | 20 | 116 | 15 | |
| Funding Rate | 50% | 64% | 73% | 82% | 100% | 86% | 100% | 95% | 84% | 84% | |
| EHR | Proposals | 4 | 1 | 9 | 5 | 5 | 1 | 6 | 9 | 20 | 5 |
| Awards | 3 | 1 | 9 | 5 | 5 | 1 | 6 | 8 | 18 | 5 | |
| Funding Rate | 75% | 100% | 100% | 100% | 100% | 100% | 100% | 89% | 90% | 95% | |
| ENG | Proposals | 107 | 91 | 94 | 83 | 65 | 59 | 68 | 95 | 662 | 83 |
| Awards | 63 | 69 | 67 | 61 | 52 | 45 | 57 | 72 | 486 | 61 | |
| Funding Rate | 59% | 76% | 71% | 73% | 80% | 76% | 84% | 76% | 73% | 73% | |
| GEO | Proposals | 40 | 44 | 41 | 36 | 28 | 27 | 40 | 55 | 311 | 39 |
| Awards | 32 | 37 | 37 | 33 | 22 | 23 | 38 | 53 | 275 | 34 | |
| Funding Rate | 80% | 84% | 90% | 92% | 79% | 85% | 95% | 96% | 88% | 88% | |
| MPS | Proposals | 68 | 46 | 44 | 42 | 35 | 27 | 32 | 16 | 310 | 39 |
| Awards | 30 | 21 | 17 | 25 | 16 | 12 | 13 | 9 | 143 | 18 | |
| Funding Rate | 44% | 46% | 39% | 60% | 46% | 44% | 41% | 56% | 46% | 46% | |
| SBE | Proposals | 8 | 21 | 28 | 12 | 15 | 14 | 18 | 30 | 146 | 18 |
| Awards | 6 | 16 | 17 | 8 | 9 | 11 | 17 | 25 | 109 | 14 | |
| Funding Rate | 75% | 76% | 61% | 67% | 60% | 79% | 94% | 83% | 75% | 75% | |
| OPP | Proposals | 2 | 2 | 7 | 11 | 11 | 6 | 11 | 14 | 64 | 8 |
| Awards | 2 | 2 | 7 | 10 | 11 | 6 | 10 | 12 | 60 | 8 | |
| Funding Rate | 100% | 100% | 100% | 91% | 100% | 100% | 91% | 86% | 94% | 94% | |
Source: NSF Enterprise Information System, as of February 1999.
| Fiscal Year | Three-year | ||||
|---|---|---|---|---|---|
| 1996 | 1997 | 1998 | Total | ||
| NSF | Total $ | $5,486,184 | $8,413,152 | $12,320,200 | $26,219,536 |
| Awards | 144 | 193 | 247 | 584 | |
| Average $ | $38,099 | $43,591 | $49,879 | $44,896 | |
| BIO | Total $ | $1,097,173 | $1,335,223 | $2,496,514 | $4,928,910 |
| Awards | 28 | 29 | 48 | 105 | |
| Average $ | $39,185 | $46,042 | $52,011 | $46,942 | |
| CSE | Total $ | $837,091 | $1,173,626 | $1,330,556 | $3,341,273 |
| Awards | 19 | 23 | 20 | 62 | |
| Average $ | $44,057 | $51,027 | $66,528 | $53,892 | |
| EHR | Total $ | $- | $263,762 | $597,469 | $861,231 |
| Awards | 6 | 8 | 14 | ||
| Average $ | $43,960 | $74,684 | $61,517 | ||
| ENG | Total $ | $1,751,818 | $2,867,796 | $4,080,144 | $8,699,758 |
| Awards | 45 | 57 | 72 | 174 | |
| Average $ | $38,929 | $50,312 | $56,669 | $49,999 | |
| GEO | Total $ | $690,827 | $1,183,592 | $2,143,438 | $4,017,857 |
| Awards | 23 | 38 | 53 | 114 | |
| Average $ | $30,036 | $31,147 | $40,442 | $35,244 | |
| MPS | Total $ | $555,634 | $650,350 | $497,735 | $1,703,719 |
| Awards | 12 | 13 | 9 | 34 | |
| Average $ | $46,303 | $50,027 | $55,304 | $50,109 | |
| SBE | Total $ | $208,557 | $625,708 | $661,043 | $1,495,308 |
| Awards | 11 | 17 | 25 | 53 | |
| Average $ | $18,960 | $36,806 | $26,442 | $28,213 | |
| O/D | Total $ | $345,084 | $313,095 | $513,301 | $1,171,480 |
| Awards | 6 | 10 | 12 | 28 | |
| Average $ | $57,514 | $31,310 | $42,775 | $41,839 | |
Source: NSF Enterprise Information System, as of February 1999.
E. Committees of Visitors (COV)
Committees of Visitors (COV) are panels of external experts convened to review the technical and managerial stewardship of NSF programs or clusters of programs. Each program that awards grants or cooperative agreements normally is reviewed on a three-year cycle. There are currently 179 such programs at NSF; 54 programs were reviewed during FY 1998. A list of all programs subject to review by a Committee of Visitors and the fiscal year of the most recent review is provided in Appendix Table 10. Due to reorganization of several directorates, COV review of a number of programs has been delayed. Where this has occurred, the directorates have been notified and have agreed to correct this situation by scheduling COVs during FY 1999 and FY 2000.
Each COV must operate in accordance with the Federal Advisory Committee Act (FACA) of 1972. In compliance with FACA regulations, virtually all COVs are established as subcommittees of an existing chartered directorate advisory committee, and the COV report is reviewed and approved by the parent advisory committee. The cognizant assistant director (AD) provides the parent advisory committee with a written response to each COV report. The COV's report and the AD's response are public documents; some have been publicized in the professional literature.
| Directorate/Division/Programs | Fiscal Year of Most Recent COV |
|---|---|
| Biological Sciences | |
| Biological Infrastructure | |
| Instrumentation & Related Activities | 1998 |
| Research Resources (new) | |
| Training (new) | |
| Environmental Biology | |
| Ecological Studies | 1998 |
| Systematic & Population Biology | 1996 |
| Integrative Biology & Neuroscience | |
| Neuroscience | 1997 |
| Developmental Mechanisms | 1997 |
| Physiology & Ethology | 1998 |
| Molecular & Cellular Biosciences | |
| Biomolecular Structure & Function | 1998 |
| Biomolecular Processes | 1998 |
| Cell Biology | 1998 |
| Genetics | 1998 |
| Directorate/Division/Programs | Fiscal Year of Most Recent COV |
|---|---|
| Computer and Information Science and Engineering (reorganized in 1997) | |
| Advanced Computational Infrastructure and Research | |
| Advanced Computational Research | 1998 |
| Partnerships for Advanced Computational Infrastructure | 1994 |
| Computer-Communication Research | |
| Communications | 1998 |
| Computer Systems Architecture | 1996 |
| Design Automation | 1995 |
| Numeric, Symbolic, and Geometric Computation | 1996 |
| Operating Systems and Compilers | 1996 |
| Signal Processing Systems | 1996 |
| Software Engineering and Languages | 1996 |
| Theory of Computing | 1996 |
| Information and Intelligent Systems | |
| Computation and Social Systems | 1995 |
| Human Computer Interaction | 1995 |
| Knowledge and Cognitive Systems | 1995 |
| Robotics & Human Augmentation | 1995 |
| Information and Data Management | 1995 |
| Special Projects (new in 1997) | |
| Advanced Networking Infrastructure and Research (was NSFNET) | |
| Networking Research | 1996 |
| Special Projects in Networking Research (new) | 1998 |
| Experimental and Integrative Activities (new in 1998) | |
| Experimental Partnerships (new in 98) | |
| CISE Research Infrastructure | |
| Advanced Distributed Resources for Experiments (new in 1998) | 1995 |
| Minority Institutional Infrastructure | |
| Digital Government (new in 1998) | 1995 |
| Instrumentation Grants for Research | |
| Educational Innovation | 1993 |
| Postdoctoral Research Associates (new in 1997) | 1995 |
| Directorate/Division/Programs | Fiscal Year of Most Recent COV |
|---|---|
| Education and Human Resources | 1998 |
| Educational Systemic Reform | |
| Statewide Systemic Initiatives | 1997 |
| Urban Systemic Initiatives | 1996 |
| Rural Systemic Initiatives | 1997 |
| EPSCoR | 1996 |
| Elementary, Secondary & Informal Education | |
| Informal Science Education | 1998 |
| Teacher Enhancement | 1996 |
| Instructional Material Development | 1997 |
| Undergraduate Education | |
| Teacher Preparation | 1997 |
| Advanced Technological Education | 1997 |
| Course, Curriculum, and Laboratory Improvement (new in 1997) | |
| Graduate Education | |
| Graduate Research Fellowships | |
| NATO Postdoctorate Fellowships | 1995 |
| Presidential Fellowships for Science, Math, Engineering and Technology Education (new in 1997) | 1997 |
| Graduate Research Traineeship (phases out in 2000) | |
| Human Resource Development | |
| Alliances for Minority Participation | 1998 |
| Centers for Research Excellence In Science and Technology | 1997 |
| Programs for Women & Girls | 1997 |
| Programs for Persons with Disabilities | 1997 |
| Minority Graduate Education (new in 1998) | |
| Historically Black Colleges and Universities (new in 1998) | |
| Comprehensive Partnerships for Math and Science Achievements | 1998 |
| Research, Evaluation & Communication | |
| Research on Education Policy & Practice (new in 1996) Evaluation | 1997 |
| Directorate/Division/Programs | Fiscal Year of Most Recent COV |
|---|---|
| Engineering | |
| Bioengineering & Environmental Systems | |
| Bioengineering | 1996 |
| Environmental and Ocean Systems | 1996 |
| Civil and Mechanical Systems | |
| Control/Mechanics/Materials | 1995 |
| Construction/Geotechnology/ Structures | 1995 |
| Hazard Reduction | 1996 |
| Chemical & Transport Systems | |
| Chemical Reaction Processes | 1997 |
| Interfacial, Transport & Separation Processes | 1997 |
| Fluid, Particulate & Hydraulic Systems | 1997 |
| Thermal Systems | 1997 |
| Design, Manufacture & Industrial Innovation | |
| Operations Research & Production Systems | 1996 |
| Design & Integration Engineering | 1997 |
| Manufacturing Processes & Equipment | 1998 |
| Small Business Innovation Research | 1998 |
| Innovation and Organizational Change (formerly MOTI) | 1996 |
| Special Studies & Analyses | 1996 |
| Grant Opportunities for Academic Liaison with Industry | 1996 |
| Small Business Technology Transfer | 1998 |
| Electrical & Communications Systems | |
| Electronics, Photonics and Device Technologies | 1996 |
| Control, Networks, and Computational Intelligence | 1996 |
| Integrative Systems | 1996 |
| Resource and Infrastructure | 1996 |
| Engineering, Education & Centers | |
| Engineering Education | 1998 |
| Human Resource Development | 1998 |
| Engineering Research Centers | 1998 |
| Industry/Univ. Cooperative Research Centers | 1998 |
| Directorate/Division/Programs | Fiscal Year of Most Recent COV |
|---|---|
| Geosciences | |
| Atmospheric Sciences | |
| - Lower Atmosphere Research | |
| Atmospheric Chemistry | 1998 |
| Climate Dynamics | 1998 |
| Meoscale Dynamic Meteorology | 1998 |
| Large-scale Dynamic Meteorology | 1998 |
| Physical Meteorology | 1998 |
| Paleoclimate | 1998 |
| - Upper Atmosphere Research | |
| Magnetospheric Physics | 1996 |
| Aeronomy | 1996 |
| Upper Atmospheric Research Facilities | 1997 |
| Solar Terrestrial Research | 1996 |
| UCAR and Lower Atmospheric Facilities Oversight (includes NCAR) | 1997 |
| Earth Sciences | |
| - Research Grants | |
| Tectonics | 1998 |
| Geology & Paleontology | 1998 |
| Hydrological Sciences | 1998 |
| Petrology & Geochemistry | 1998 |
| - Special Projects | |
| Education & Human Resources | 1997 |
| Instrumentation & Facilities | 1997 |
| Continental Dynamics | 1998 |
| Geophysics | 1998 |
| Ocean Sciences | |
| - Oceanographic Centers & Facilities | |
| Ship Operations | 1994 |
| Oceanographic Facilities | 1994 |
| Ocean Drilling | 1994 |
| Oceanographic Instrumentation & Technical Services | 1994 |
| - Ocean Science Research | |
| Marine Geology & Geophysics | 1998 |
| Biological Oceanography | 1998 |
| Chemical Oceanography | 1998 |
| Physical Oceanography | 1998 |
| Oceanographic Technology & Interdisciplinary Coordination | 1998 |
| Directorate/Division/Programs | Fiscal Year of Most Recent COV |
|---|---|
| Mathematical and Physical Sciences | |
| Astronomical Sciences | |
| Planetary Astronomy | 1996 |
| Stellar Astronomy & Astrophysics | 1996 |
| Galactic Astronomy | 1996 |
| Education, Human Resources and Special Programs | 1996 |
| Gemini Telescopes Project | 1996 |
| National Optical Astronomy Observatories (NOAO) | 1996 |
| Advanced Technologies & Instrumentation | 1996 |
| National Radio Astronomy Observatory (NRAO) | 1996 |
| National Astronomy & Ionosphere Center (NAIC) | 1996 |
| University Radio Facilities | 1996 |
| Electromagnetic Spectrum Management | 1996 |
| Chemistry | |
| Special Projects | 1998 |
| Chemical Instrumentation | 1998 |
| Organic & Macromolecular Chemistry | 1998 |
| Organic Dynamics | 1998 |
| Organic Synthesis | 1998 |
| Physical Chemistry | 1998 |
| Theoretical and Computational | 1998 |
| Experimental Physical Chemistry | 1998 |
| Inorganic, Bioinorganic & Organometallic Chemistry | 1998 |
| Analytical & Surface Chemistry | 1998 |
| Materials Research | |
| Condensed Matter Physics | 1996 |
| Materials Theory | 1996 |
| Metals, Ceramics & Electronic Materials | 1996 |
| Solid-State Chemistry & Polymers | 1996 |
| National Facilities & Instrumentation | 1996 |
| Materials Research Science and Engineering Centers | 1996 |
| Mathematical Sciences | |
| Applied Mathematics | 1998 |
| Infrastructure | 1998 |
| Geometric Analysis, Topology and Foundations | 1998 |
| Analysis | 1998 |
| Algebra & Number Theory | 1998 |
| Statistics & Probability | 1998 |
| Physics | |
| Atomic, Molecular and Optical and Plasma Physics | 1997 |
| Elementary Particle Physics | 1997 |
| Theoretical Physics | 1997 |
| Nuclear Physics | 1997 |
| Gravitational Physics | 1997 |
| Directorate/Division/Programs | Fiscal Year of Most Recent COV |
|---|---|
| Social, Behavioral and Economic Science | |
| International Programs | 1994 |
| Social, Behavioral & Economic Research | |
| - Economic, Decision & Mgt. Sciences Cluster | |
| Economics | 1997 |
| Decision, Risk & Management Sciences | 1997 |
| Innovation and Organizational Change (new in 1998) | |
| - Anthropology & Geographic Sciences Cluster | |
| Cultural Anthropology | 1995 |
| Physical Anthropology | 1995 |
| Archeology | 1995 |
| Geography | 1996 |
| - Social & Political Science Cluster | |
| Sociology | 1996 |
| Political Science | 1997 |
| Law & Social Science | 1995 |
| - Infrastructure, Methods & Science Studies Cluster | |
| Ethics & Values Studies | 1996 |
| Science & Technology Studies | 1996 |
| Methodology, Measurement & Statistics | 1996 |
| - Cognitive, Psych. & Language Sci. Cluster | |
| Linguistics | 1996 |
| Human Cognition & Perception | 1996 |
| Social Psychology | 1996 |
| Directorate/Division/Programs | Fiscal Year of Most Recent COV |
|---|---|
| Office of Polar Programs | |
| Polar Research Support | 1998 |
| Antarctic Sciences | |
| Aeronomy and Astrophysics | 1997 |
| Biology and Medicine | 1997 |
| Geology and Geophysics | 1997 |
| Glaciology | 1997 |
| Ocean and Climate Systems | 1997 |
| Arctic Sciences | |
| System Sciences | 1997 |
| Natural Sciences | 1997 |
| Social Sciences | 1997 |
If you have any questions or comments concerning this report, please send your them to Dr. Albert Bridgewater at abridgew@nsf.gov.
F. Exemptions to the Merit Review Process
Authorized exemptions to the peer review process are listed in NSF Manual 10, Section 122 (below) and include routine award actions such as continuing grant increments and no-cost extensions. In special circumstances, the Director or designee may waive peer review requirements. Such waivers of peer review were granted 7 times during FY 1998; 5 for OIA, 1 for SBE and 1 for CISE.