
NSF I-Corps Teams
Designed and developed in 2012, the NSF National I-Corps Teams program equips participants with the entrepreneurial skills, mentorship and industry connections needed to explore the commercial potential of their innovations. The program offers:
- Fast-paced discovery of industrial needs ("customer discovery"), a prerequisite for any deep-tech venture that, in turn, informs both a technology development plan and an associated venture launch strategy.
- A framework to bring together experienced mentors, commercial experts, promising technologies and research talent to formulate ways to address challenges in the nation's most advanced industries.
Through immersive, hands-on, practical entrepreneurial experience, teams learn to validate their ideas directly with potential customers and pivot based on real-world feedback — fast-tracking their path from concept to impact.
FY 2023–2024
- 10 NSF I-Corps Hubs, representing 128 institutions of higher education.
- 685 participating National I-Corps Teams, representing 2,307 individuals.
Since program inception
- 52% of participating National I-Corps teams have been linked to startups.
- $7.01 billion raised in follow-on funding (1:3 public-to-private funding ratio) by NSF National I-Corps Teams.
- $1.06 million raised in follow-on funding by nascent NSF Regional I-Corps Teams.
Growing the entrepreneurial workforce
The NSF National I-Corps Teams program has grown steadily, from 509 teams in FY 2017–2018 to 685 teams in FY 2023–2024 (Table 1). This growth demonstrates the scalability and sustainability of the program model.
Quick facts
- 57% of entrepreneurial leads on National I-Corps teams were graduate students in FY 23–24.
Table 1. Sources of NSF National I-Corps Teams
| Since 2012 | FY 17–18 | FY 19–20 | FY 21–22 | FY 23–24 | ||
| Characteristics | National teams trained1 | 3,231 | 509 | 593 | 638 | 685 |
| Teams with female members | 1,556 (48%) | 237 (47%) | 289 (49%) | 366 (57%) | 363 (53%) | |
| Cohorts2 | Completed cohorts | 148 | 25 | 27 | 28 | 30 |
| Source of national teams (non-exclusive categories)3 | Prior NSF funding ("prior NSF research lineage")4 | 1,970 | 241 | 318 | 219 | 324 |
| 588 | 168 | 189 | 137 | 41 | |
| 500 | 99 | 187 | 156 | 20 | |
| 173 | -- | -- | 5 | 168 | |
| Other federal agencies5, 6 | 44 | 25 | 8 | 3 | 0 | |
| 28 | 17 | 8 | 3 | 0 | |
| 9 | 1 | 0 | 0 | 0 | |
| 7 | 7 | 0 | 0 | 0 | |
| SBIR/STTR programs | 333 | 9 | 70 | 118 | 130 | |
| 28 | 4 | 6 | 10 | 8 | |
| 26 | 4 | 3 | 7 | 8 | |
| 279 | 1 | 61 | 101 | 114 |
- Number of teams that participated in the NSF I-Corps program: 97 in FY 2012, 135 in FY 2013, 133 in FY 2014, 176 in FY 2015, 265 in FY 2016, 232 in FY 2017, 277 in FY 2018, 267 in FY 2019, 326 in FY 2020, 326 in FY 2021, 312 in FY 2022, 348 in FY 2023 and 337 in FY 2024.
- There were four cohorts in FY 2012, six in FY 2013, six in FY 2014, eight in FY 2015, 14 in FY 2016, 12 in FY 2017, 13 in FY 2018, 13 in FY 2019, 14 in FY 2020, 14 in FY 2021, 14 in FY 2022, 15 in FY 2023 and 15 in FY 2024.
- Since FY 2021, entering pathways (how teams entered the NSF I-Corps program) were treated as exclusive categories (except Memoranda of Understanding (MOUs)). As such, the sum across all sources of teams (except MOUs) will add up to the total number of teams trained. MOUs are excluded from this calculation, as teams that enter into the program through MOUs have already been accounted for in other mutually exclusive categories.
- To respond to the mandate, set by the "American Innovation and Competitiveness Act," Section 601(c)(3), the NSF Partnerships for Innovation (PFI) program provides funding to support prototype or proof-of-concept development research. Starting in FY 2019 with solicitation NSF 19-506, PFI award recipients who have not previously participated in the NSF I-Corps Teams program must allocate $50,000 of their budget to do so and to acquire a better understanding of the commercial aspects of translating an innovation toward a market application.
- NSF has executed a total of nine MOUs with eight federal agencies. The MOUs are with ARPA-E (part of DOE), the Office of Energy Efficiency and Renewable Energy (part of DOE), DOD, DHS, National Institute of Food and Agriculture (part of USDA), NASA, National Center for Advancing Translational Sciences (part of the National Institutes of Health), National Security Agency and Small Business Administration. For the reporting period between FY 2023–2024, a total of 16 teams participated in the NSF I-Corps program via MOU: eight teams from NASA through their STTR program and eight teams from DHS through their SBIR program.
- NSF also signed an MOU with the Science Foundation of Ireland (SFI). SFI sent eight teams to participate in the NSF I-Corps program during the FY 2017–2018 reporting period and five teams during the FY 2019–2020 reporting period. No teams were sent to the program during the FY 2021 and 2022 reporting period due to the COVID-19 pandemic. The MOU between the two agencies was renewed in FY 2021. During the current reporting period (FY 2023–2024), two teams were sent to participate in the program.
Starting points for NSF I-Corps Teams
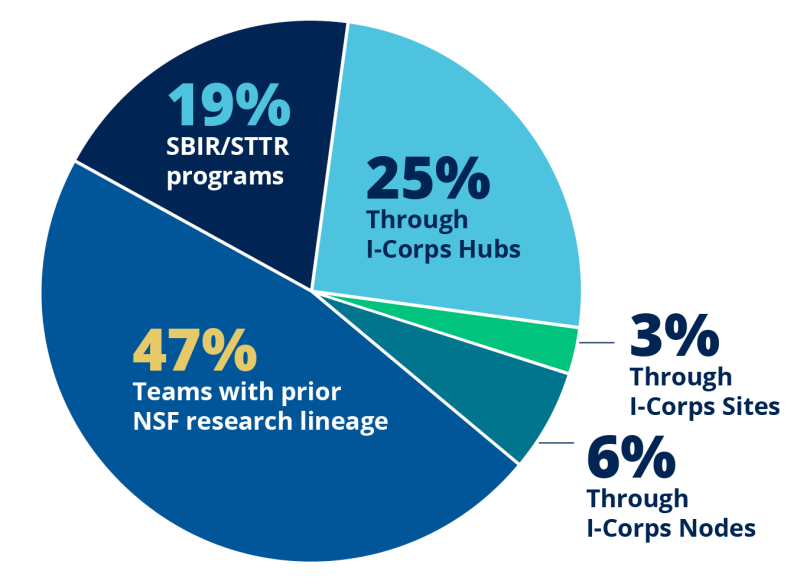
The cohorts of teams entering the national ecosystem through the NSF National I-Corps Teams program have a variety of starting points in the translation spectrum (Figure 1):
- 47% of NSF National I-Corps teams had prior NSF funding ("prior NSF research lineage"), demonstrating a strong pipeline for leveraging taxpayer funding for the development of new technologies, products and services that benefit the nation.
- 25% of NSF National I-Corps teams were suggested/vetted through the NSF I-Corps Hubs, which are key to local and regional innovation networks.
- 19% of NSF National I-Corps teams came from the Small Business Innovation Research (SBIR)/Small Business Technology Transfer (STTR) programs, significantly enhancing their chances at commercial success, innovation readiness and long-term impact. SBIR/STTR teams that go through NSF I-Corps build bridges between technical innovationand market success. The I-Corps experience transforms the startups' innovations into real-world impact by enabling the teams to develop entrepreneurial skills, market insights and commercialization strategies, maximizing the value of public investment in innovation.
Participation in NSF National I-Corps Teams
A total of 2,307 individuals participated in NSF National I-Corps Teams in FY 2023-2024, an increase of 6% from the previous reporting period (Figure 2, Table 2).
Each NSF National I-Corps Team consists of at least three people: an entrepreneurial lead, a technical lead and an industry mentor.
Of the 2,307 individuals who completed the NSF National I-Corps program from FY 2023-2024, graduate students comprised 57% of the entrepreneurial leads.
These graduate students often work on cutting-edge technologies such as artificial intelligence, biotechnology, materials science and quantum computing. They see firsthand the potential for real-world applications — often before the market does.
The NSF I-Corps program has a significant impact on the development of a translational mindset early in scientists' and engineers' careers. Creating a startup as a result of an immersive, hands-on, practical entrepreneurial experience enables undergraduates, graduate students and postdocs to solve national problems, create jobs and improve the United States' standing in the global marketplace.
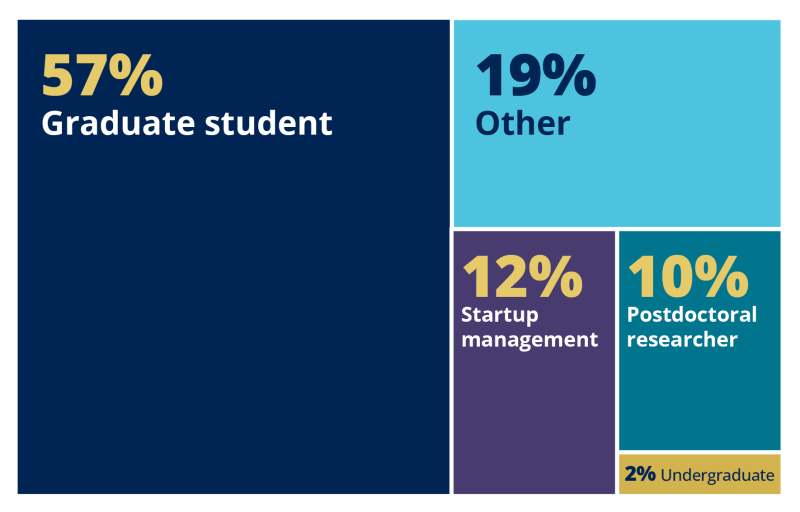
Table 2. Number of NSF National I-Corps team participants
| Since 2012 | FY 17–18 | FY 19–20 | FY 21–22 | FY 23–24 | ||
| Statistics | Individuals1 | 9,953 | 1,628 | 1,928 | 2,173 | 2,307 |
| Women2 | 2,096 (21%) | 338 (21%) | 411 (21%) | 516 (24%) | 527 (23%) | |
| Entrepreneurial leads3 | 3,953 | 632 | 744 | 837 | 883 | |
| Women entrepreneurial leads4 | 1,027 (26%) | 164 (26%) | 204 (27%) | 261 (31%) | 258 (29%) | |
| Entrepreneurial lead status at time of participation5 | Graduate student | 1,468 (54%) | 205 (52%) | 251 (49%) | 241 (54%) | 338 (57%) |
| Postdoctoral researcher | 363 (13%) | 62 (16%) | 56 (11%) | 51 (11%) | 61 (10%) | |
| Undergraduate student | 87 (3%) | 16 (4%) | 22 (4%) | 18 (4%) | 13 (2%) | |
| Startup management | 292 (11%) | 27 (7%) | 116 (22%) | 68 (15%) | 71 (12%) | |
| Other6 | 528 (19%) | 81 (21%) | 70 (14%) | 66 (15%) | 111 (19%) |
- Number of distinct program participants, based on name, affiliation and biographical sketch submitted with the application and proposal.
- Overall, for individuals that participated in the NSF I-Corps program between FY 2012 and FY 2024, 21% self-reported as female, 66% as male and 13% offered no response. For individuals that participated between:
- FY 2019 and FY 2020: 21% self-reported as female, 67% as male and 11% offered no response.
- FY 2021 and FY 2022: 24% self-reported as female, 61% as male and 15% offered no response.
- FY 2023 and FY 2024: 23% self-reported as female, 64% as male and 13% offered no response.
- There are some teams that have more than one entrepreneurial lead.
- Overall, for entrepreneurial leads that participated in the NSF I-Corps program between FY 2012 and FY 2022, 25% self-identified as female, 64% as male and 11% offered no response. For individuals that participated between:
- FY 2017 and FY 2018: 26% self-identified as female, 71% male and 3% offered no response.
- FY 2019 and FY 2020: 27% self-identified as female, 63% male and 10% offered no response.
- FY 2021 and FY 2022: 31% self-identified as female, 58% male and 11% offered no response.
- FY 2023 and 2025: 29% self-identified as female, 63% male and 8% offered no response.
- Only participants with NSF I-Corps Teams awards were counted. Entrepreneurial leads from teams funded through the NSF SBIR/STTR and PFI programs, as well as those teams that came through the program through other funding sources, were not included.
- Among 111 entrepreneurial leads in the 'Other' category, 46% held a university research position (i.e. researcher, research analyst, research associate, research assistant, research manager, etc.), 35% were university faculty members (lecturer, professor), and the remaining 19% held a wide variety of positions, from high school teacher to software developer to project manager in a company.
Translating technologies
Because each NSF National I-Corps Team considers the potential benefits of a new technology, the number of teams serves as a rough measure of the volume of technologies validated through the program.
Since FY 2012, NSF National I-Corps Teams have explored more than 3,200 technologies (Table 3). These metrics suggest the vast potential that NSF I-Corps offers in identifying tangible uses for federally funded technologies.
Quick facts
- 3,200+ technologies explored by NSF National I-Corps teams since FY 2012.
Enabling economic impact
Because startups and small business growth have a disproportionately large, positive impact on the economy, an important measure of impact is the number of new ventures launched and their subsequent success rates in attracting both public funding and private investment to enable their continued growth.
Since the inception of NSF I-Corps, 52% of participating NSF National I-Corps teams (1,696 teams) have launched startups.
Quick facts
- 52% of teams participating in the NSF National I-Corps Teams training have launched startups since the program's inception.
- $7.01 billion in subsequent funding has been raised by these startups.
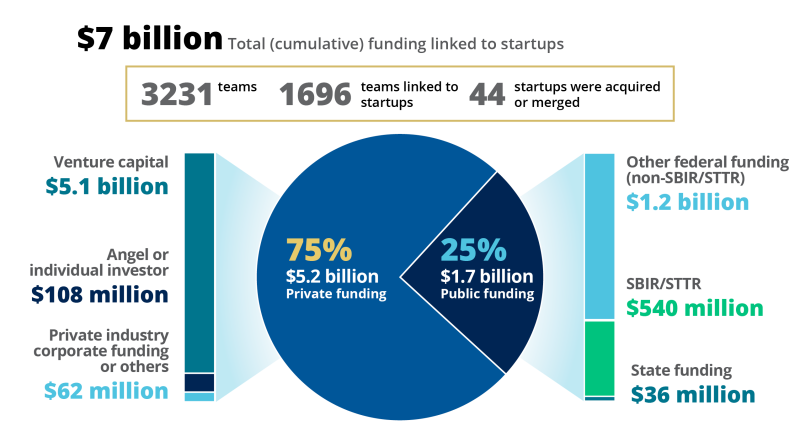
As shown in Figure 3 and Table 3, these startups have cumulatively raised a formidable $7.008 billion in subsequent funding. This total includes:
- $1.745 billion in public funding (including SBIR/STTR and other federal and state funding).
- $5.262 billion in private investment (including venture capital, angel or individual investors and private industry, corporate funding, etc.).
This return on public investment showcases the power of early-stage support, where relatively small public investments help unlock massive private sector funding, leading to job creation, economic growth and global leadership for the United States.
Table 3. Subsequent funding raised by startups associated with the NSF National I-Corps teams since the program's inception
| FY 12–18 | FY 12–20 | FY 12–22 | FY 12–24 | ||
| Startups | Teams (total) | 1,315 | 1,908 | 2,546 | 3,231 |
| Startups linked to teams1 | 644 (49%) | 1,036 (54%) | 1,380 (54%) | 1,696 (52%) | |
| Startups acquired or merged | 6 | 9 | 27 | 44 | |
| Subsequent funding2 and funding sources | Cumulative funding linked to startups3 | $301,306,916 | $760,523,044 | $3,165,993,080 | $7,008,162,752 |
| - Public funding | $139,818,329 (46%) | $425,934,549 (56%) | $1,015,945,888 (32%) | $1,745,328,007 (25%) | |
| $116,575,026 | $289,312,261 | $373,198,873 | $540,331,251 | |
| $12,556,891 | $119,580,890 | $616,307,821 | $1,169,078,985 | |
| $10,686,412 | $17,041,398 | $26,439,194 | $35,917,771 | |
| - Private funding | $161,488,587 (54%) | $334,588,495 (44%) | $2,150,047,191 (68%) | $5,262,834,745 (75%) | |
| $134,791,526 | $280,076,626 | $2,017,335,715 | $5,092,975,297 | |
| $22,315,539 | $22,224,124 | $99,935,008 | $108,126,566 | |
| $4,381,522 | $32,287,745 | $32,776,468 | $61,732,882 |
- Some teams are linked to more than one startup business, and some startup businesses are linked to more than one team. Note: Some of the teams were SBIR/STTR companies prior to participating in the I-Corps program (and thus were already startup businesses prior to program participation); these participants' NSF SBIR and STTR awards were excluded from the subsequent funding data.
- Subsequent funding excludes financial support from the I-Corps award and only includes funding obtained during and/or after I-Corps participation. A combination of data sources was used to estimate the amount of subsequent funding that teams obtained: USA spending data for federal funding, Pitchbook (third-party market and private and venture capital data provider) and SEC filings for private funding.
- Funding is cumulative through the end of the fiscal year for a given reporting period. For example, for the reporting period FY 2019–2020, the (cumulative) subsequent funding of $954,645,544 represents all funding obtained through the end of FY 2024 (Sept. 30, 2024) by those startups linked to the teams that participated in the I-Corps program during FY 2019–2020. Note: The total cumulative funding obtained as of the end of FY 2020 and FY 2022 were included to serve as a reference for readers to see growth in funding; these numbers were reported in previous I-Corps reports.
NSF I-Corps Hubs
The success of the NSF National I-Corps Teams program prompted NSF to transition from a "Nodes" and "Sites" model to a "Hubs" model in 2021 (see Table 4). This transition enabled NSF to streamline, scale and enhance the program's innovation infrastructure by enabling greater coordination and efficiency; broadening its geographic reach; increasing its scalability and sustainability; standardizing training; incorporating best practices and enhancing collaboration and impact.
Each NSF I-Corps Hub comprises a consortium of at least eight institutions of higher education, including a lead institution and partner universities, collaborating to provide immersive, hands-on, practical experience including access to experienced mentors and commercial experts, and support to researchers across various scientific and technical disciplines.
The primary objectives of the NSF I-Corps Hubs include delivering regional NSF I-Corps programs, identifying and supporting promising research teams, and conducting evaluations to assess and enhance the program's impact.
In FY 2024, there were 10 NSF I-Corps Hubs, and they include 128 colleges and universities (Table 4).
Quick facts
- 10 Hubs representing 128 institutions as of FY 2024.
- 4,300+ teams provided by training and access to experienced mentors and networks via the Hubs.
The National Innovation Network
The NSF I-Corps Hubs serve as the operational backbone of the National Innovation Network (NIN), a nationwide network that connects universities, NSF-funded researchers, entrepreneurs and federal agencies to facilitate the commercialization of deep technologies — innovations rooted in fundamental science and engineering.
By engaging with local and regional entrepreneurial communities in shorter and potentially more specialized programming, the Hubs build and sustain an extensive innovation ecosystem throughout the United States, allowing all Americans equal access to immersive, hands-on, practical entrepreneurial experience.
This collaborative approach not only accelerates the commercialization process but also contributes to economic growth by fostering the development of new technologies, products and services that benefit the nation.
Table 4. Structure of NIN and annual I-Corps program funding
| FY 17–18 | FY 19–20 | FY 21–22 | FY 23–24 | ||
| National Innovation Network (NIN) | Active I-Corps Nodes | 9 | 9 | 9 | 2 |
| 28 | 28 | 28 | 5 | |
| Active I-Corps Sites | 99 | 92 | 59 | 20 | |
| 99 | 92 | 59 | 20 | |
| Active I-Corps Hubs1 | -- | -- | 10 | 10 | |
| -- | -- | 94 | 128 | |
| Annual program funding (NSF funding level2) | FY 2017 | $29,848,028 | |||
| FY 2018 | $32,817,459 | ||||
| FY 2019 | $32,824,943 | ||||
| FY 2020 | $37,953,776 | ||||
| FY 2021 | $39,022,125 | ||||
| FY 2022 | $39,933,520 | ||||
| FY 2023 | $51,907,860 | ||||
| FY 2024 | $50,104,876 |
Nurturing an innovation ecosystem
By engaging local and regional teams with shorter and potentially more specialized programming, the NSF I-Corps Hubs have been able to very quickly build extensive innovation ecosystems, providing immersive, hands-on, practical entrepreneurial experience to NSF Regional I-Corps Teams.
This local entrepreneurial experience enables regional teams to participate in real-world customer discovery, providing regional economic development and, most importantly, providing impetus for a culture shift in academia.
Quick facts
- $106 million in follow-on funding raised by startups formed by regional teams.
- 1:2 public-to-private funding ratio in follow-on funding raised by regional team startups.
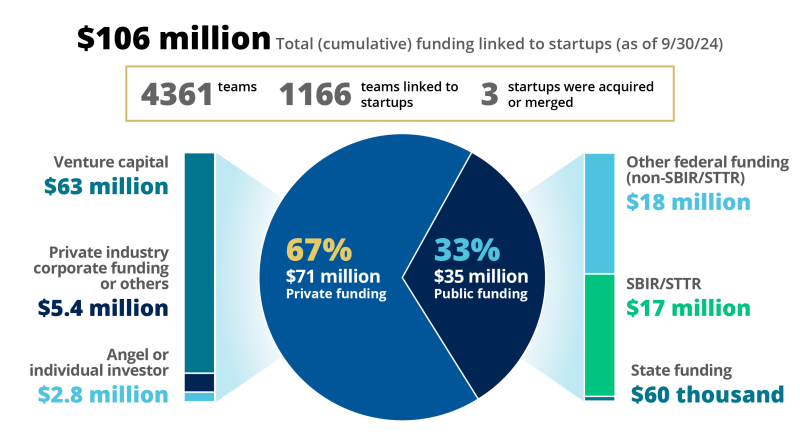
In the short timeframe that the NSF I-Corps Hubs have operated (one to two years), they have been able to raise $106 million in follow-on funding (Figure 4).
The teams entering the Regional I-Corps program have a lower bar to participation: shorter programs, flexible and often smaller team composition, fewer customer discover requirements, open to a wider range of participants (including non-university entrepreneurs), etc. This encourages numerous teams (4,361 teams) to access the program and yet demonstrates a significant conversion of teams to startups (27%).
The startups resulting from the NSF Regional I-Corps Teams (and trained at the nascent NSF I-Corps Hubs) attracted an additional $35 million in public funding, from federal agencies (including SBIR/STTR programs that are essential for early-stage startup support) and state funding, indicating buy-in from their regions.
These nascent NSF Regional I-Corps Team-based startups were also able to attract $71 million from private funding, including:
- Venture capital, reflecting confidence from investors.
- Corporate/private industry, signaling commercial interest.
- Angel investors, showing grassroots investor engagement.
The 1:2 public-to-private funding ratio suggests that relatively small amounts of NSF funding are very effective in catalyzing private investment.
The early returns also suggest that the Regional I-Corps Teams model is a ready complement to the NSF National I-Corps Teams program, enabling sustainable scale-up, effectively widening the geostrategic reach of NSF's innovation investment (Table 5).
Table 5. Subsequent funding raised by startups associated with the NSF Regional I-Corps teams in the current reporting period
| FY 23–241 | ||
| Teams | Teams | 4,361 |
| Teams linked to startups2 | 1,166 (27%) | |
| Startups | Startups formed | 1,167 |
| Startups that merged or were acquired | 3 | |
| Subsequent funding3 | Subsequent funding linked to startups | $106,407,375 |
| Source of subsequent funding obtained by startups | Public funding | $35,523,383 |
| $16,961,096 | |
| $18,502,287 | |
| $60,000 | |
| Private funding | $70,883,992 | |
| $62,601,592 | |
| $2,850,000 | |
| $5,432,400 |
- Data are cumulative through FY 2024.
- Some teams are linked to more than one startup business, and some startup businesses are linked to more than one team.
- Subsequent funding excludes financial support from the I-Corps award and only includes funding obtained during and/or after I-Corps participation. A combination of data sources was used to estimate the amount of subsequent funding that teams obtained: USA spending data for federal funding and Pitchbook (third party market and private and venture capital data provider) and SEC filings for private funding.