
A new map reveals the hidden electrical structure across the continental United States
Researchers complete a map with magnetotelluric data, aiding space weather mitigation efforts as well as geothermal and mineral resource investigations
The United States Magnetotelluric Array (USMTArray) completed the first comprehensive survey of electrical properties of the rocks beneath the continental United States. The map reveals how electrical currents flow through underground geologic features that make up the roots of North America, including ancient faults, extinct volcanoes, deep fluids and ore deposits. This special insight allows researchers to more precisely provide warnings for space weather hazards and discover geothermal resources and critical mineral deposits deep underground.
Researchers published a review paper capturing the history and impact of the array, which was largely made possible by funding from the U.S. National Science Foundation. The paper looks at 18 years of work at 1,800 locations across the country.
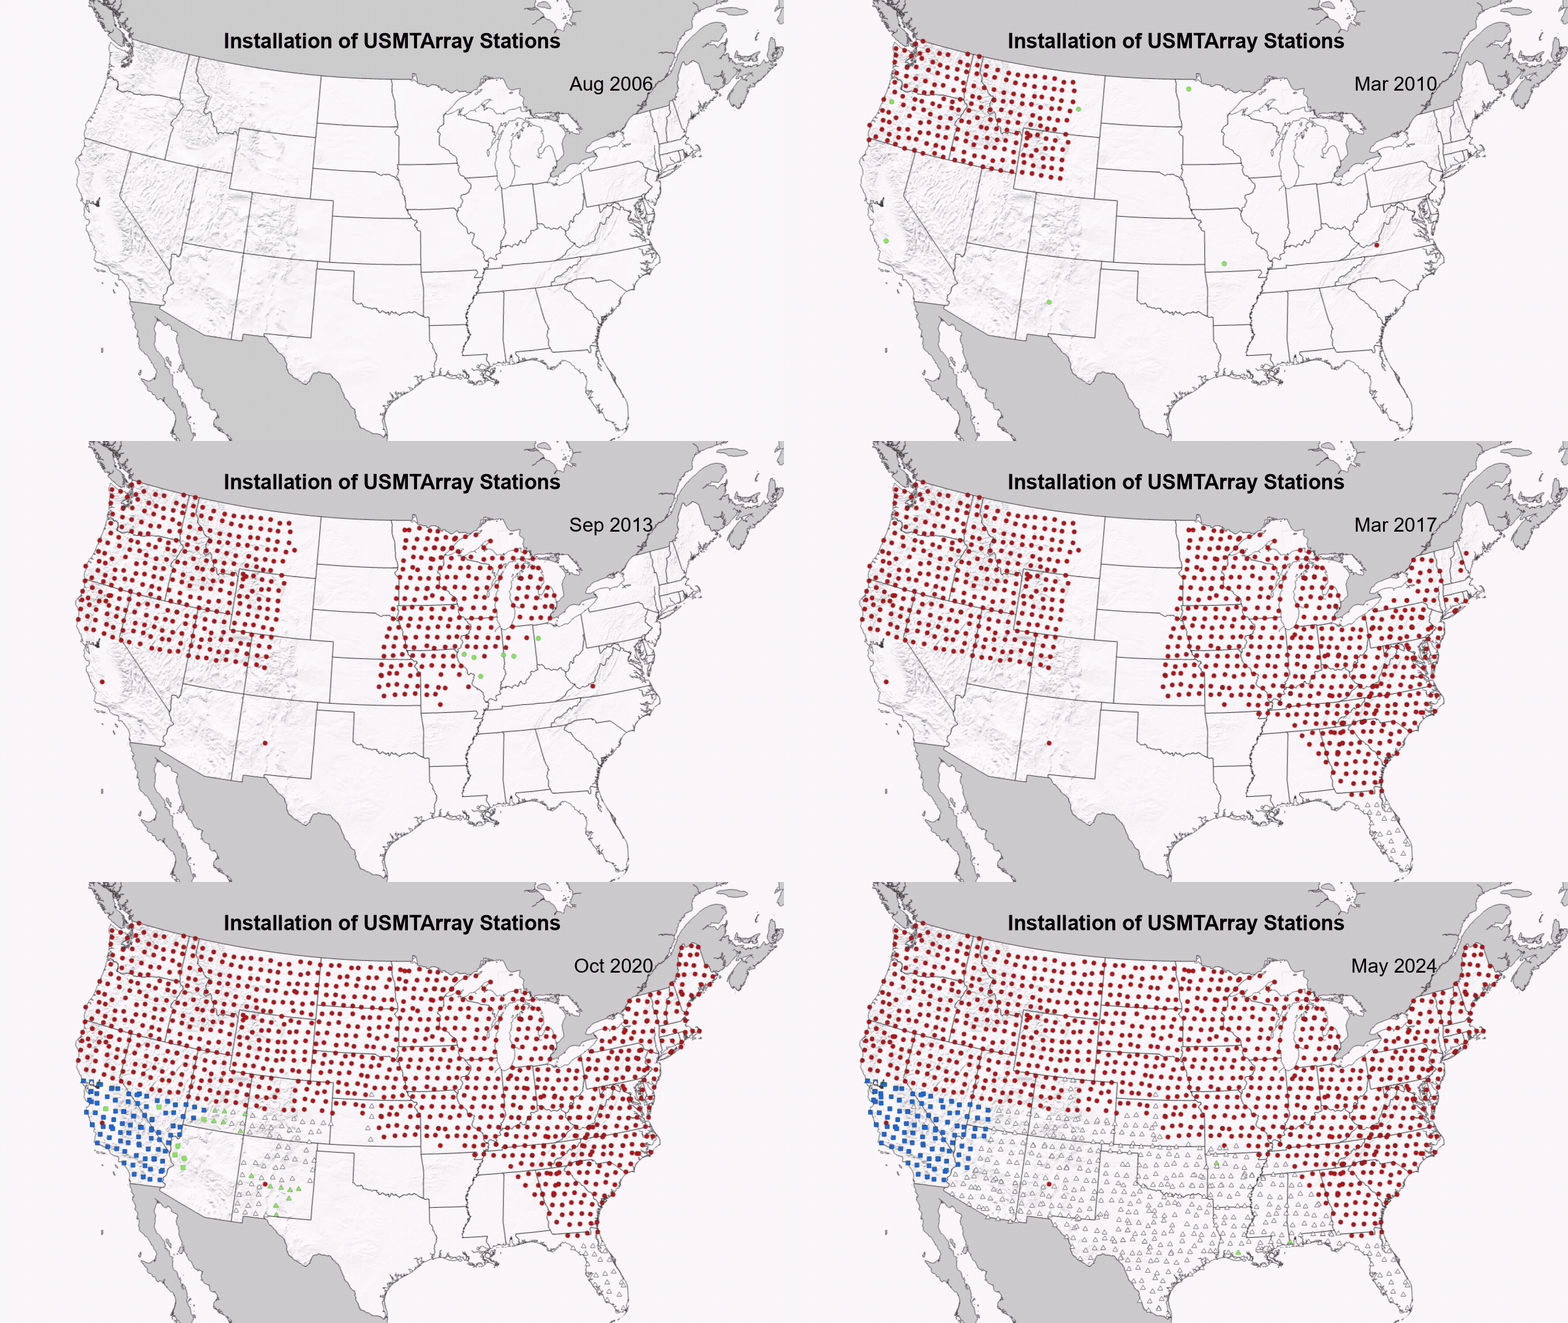
A moving image of dots across the USA that displays the installation of the United States Magnetotelluric Array (USMTArray) stations.
Courtesy of USGS
Wait, is that Magneto's superpower?
Magnetotellurics may sound like something that happens in a Marvel comic, but it entails measuring changes in the magnetic and electric fields at Earth's surface to see how effectively subsurface rocks and sediments conduct electricity.
As solar wind and lightning storms send electromagnetic waves through the atmosphere and into rock layers, those rocks will either resist the waves or absorb them, depending on what they are. Low-frequency electromagnetic waves travel deeper into rock layers, while high-frequency waves only penetrate the surface.
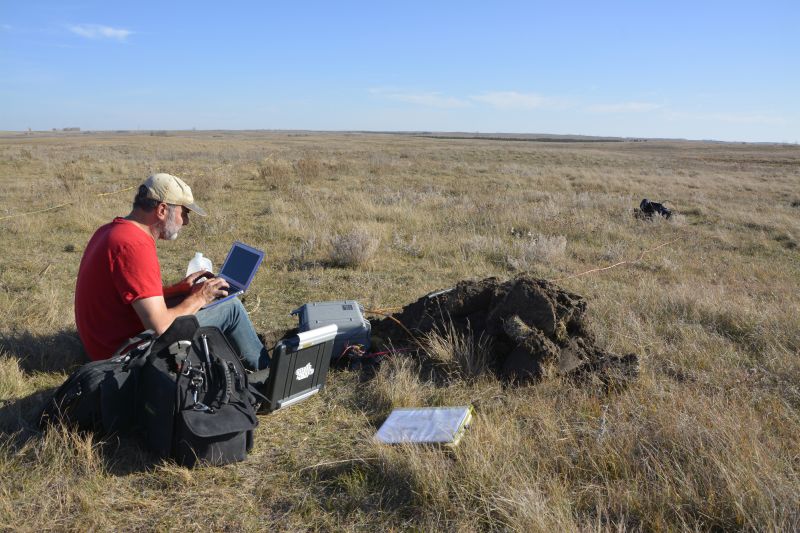
Researchers use magnetotelluric (MT) stations to measure the electric and magnetic fields across an area. These include a cabled magnetometer and four electrodes buried approximately 50 cm belowground. Researchers record electric and magnetic field data for up to a few weeks and use complex data-processing techniques to create 3D models that reveal how conductive the rocks are.
From then to now
Before MT stations were available in large numbers, researchers would use a single parameter to forecast how electricity moved underground across entire geologic regions and sometimes even multiple states.
In 2003, NSF awarded operation and management to IRIS for the USArray facility, another NSF-supported project to install seismographs across the country to record local, regional and distant earthquakes. This new grant included MT stations to reflect how researchers had begun to adopt MT techniques to study subduction zones and volcanic systems. From there, the efforts grew and gained support from NASA and the U.S. Geological Survey (USGS) to become a multiagency-supported USMTArray.
For USMTArray, stations were spaced just over 70 kilometers apart. These modern MT data and advanced 3D models have shown how geoelectric hazards, such as disruptions to global positions and wireless communications, as well as induced currents in the power grid, can be very different between two locations only a few kilometers apart.
The completed USMTArray provides data to a real-time risk map managed by the National Oceanic and Atmospheric Administration and the USGS. Areas of interest are being infilled with more MT stations operated by the USGS to ensure the risk assessment is tuned to the complexity of the geologic structures beneath the United States.
EarthScope Consortium was officially established in 2023, following the merger of IRIS and UNAVCO, which historically managed data and infrastructure for seismology and geodesy, respectively. EarthScope Consortium currently manages the NSF National Geophysical Facility, which hosts MT instruments for researchers to use.
From fundamental to applied research
Researchers used the USMTArray to create a detailed image of the U.S.'s underlying geology. Its 3D electrical model shows how landmasses collided into each other millions of years ago and reveals how North America took shape.
MT studies have investigated active subduction along the Cascadia subduction zone, providing detailed images of the distribution of subduction-zone fluids along and across the plate margin, and constraints on the generation and transport of melts that ultimately feed the magmatic arc. These details help scientists better understand the behavior of faults and volcanoes responsible for major natural hazards in parts of the U.S.
MT data also reveals how geoelectric fields are induced in the Earth during magnetic storms. These fields can interfere with the operation of grounded electric-power transmission systems, cutting off vital infrastructure. These "geomagnetically induced currents" occur in human infrastructure when the deep rocks are too resistive to electric currents seeking to travel through them. When the currents jump into nearby electric grid infrastructure, they can accelerate normal wear and tear or even overload high-voltage transformers, causing blackouts. These hazards can also extend to pipelines and other sensitive infrastructure that are not intended to receive electric currents.
Higher-frequency MT studies, including those focused on wideband or broadband and audio MT, are used for mineral prospecting. USMTArray data and complementary USGS data can be used to develop fundamental connections to regional-scale features, which could be the starting point for broad subsurface assessments.
The USMTArray dataset also provides a good foundational assessment for prospecting specific areas with potential for geothermal development. However, additional surveys are needed with closer spacing and higher frequency sampling.